
User's Guide
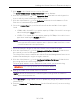
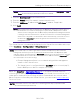
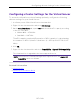

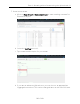
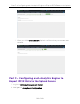
Table Of Contents
- ExtremeAnalytics® User GuideVersion 8.4
- Legal Notices
- Trademarks
- Contact
- Extreme Networks® Software License Agreement
- Table of Contents
- ExtremeAnalytics™ Help
- ExtremeAnalytics Licensing
- Configuring Enhanced Netflow for Extreme Analytics and Extreme Wireless Contr...
- How to Deploy ExtremeAnalytics in an MSP or MSSP Environment
- ExtremeAnalytics Tab Overview
- ExtremeAnalytics Dashboard Overview
- ExtremeAnalytics Insights Dashboard
- ExtremeAnalytics Tracked Applications Dashboard
- ExtremeAnalytics Browser Overview
- ExtremeAnalytics Application Flows
- ExtremeAnalytics Fingerprints Overview
- ExtremeAnalytics Custom Fingerprints
- Delete Custom Fingerprints
- Custom Fingerprint Examples
- Create Custom Fingerprints Based on Flow
- Create Custom Fingerprints Based on Destination Address
- Create Custom Fingerprints Based on Application or Application Group
- ExtremeAnalytics Packet Captures
- ExtremeAnalytics Configuration Overview
- Virtual Sensors
- ExtremeAnalytics Engine Advanced Configuration
- Flow Collection Type
- Collection Privacy Levels
- Client Aggregation
- Slow Client Data
- Max End-Systems in Hourly Details
- Sensor Log Levels
- Store Application Site Data
- ExtremeControl Integration
- Flow Sources/Application Telemetry Sources
- Web Credentials
- Configuration Properties
- Sensor Modules
- Auditing
- Network Settings
- ExtremeAnalytics Reports
- ExtremeAnalytics Report Descriptions
- Report Descriptions
- Analytics Events
- Bandwidth for a Client Over Time
- Interface Top Applications Treemap
- Sites Using the Most Bandwidth
- Most Popular Applications
- Most Used Applications for a Client
- Most Used Applications for a User Name
- Network Activity by Site
- Network Activity by Client
- Network Activity by Application
- Slowest Applications by Site
- Top Applications Group Radar
- Top Applications Radar
- Top Applications TreeMap
- Top Applications for Interface
- Top Applications for Server
- Top Clients by Interface
- Top Interfaces by Application
- Top N Applications
- Top N Clients
- Top N Servers
- Report Descriptions
- Add and Modify Fingerprints
- Add Fingerprints
- Enable or Disable Fingerprints
- Modify Fingerprints
- Update Fingerprints
- Custom Fingerprint Examples
- How to Deploy ExtremeAnalytics in an MSP or MSSP Environment
- ExtremeAnalytics Virtual Sensor Configuration in Extreme Management Center
- Stream Flow Data from ExtremeAnalytics into Splunk
- Stream Flow Data from ExtremeAnalytics into Elastic Stack

Adding the Virtual Sensor in ExtremeAnalytics
191 of 218
3. Click Install in the Virtual Sensors section of the tab.
The Install Virtual Sensor on Hypervisor Host window displays.
4. Click the ellipsis button ( ) in the Hypervisor Host field and select the hypervisor
host on which you are installing the Virtual Sensor.
5. Click the ellipsis button ( ) in the Datastore field and select the datastore, if the
field does not automatically populate.
6. Select the License Type for your Virtual Sensor from the available license types
listed:
l VS100 — One virtual CPU core with a capacity of 1Gbps. Select this license type
when installing the Small .OVAfile.
l VS250 — Two virtual CPU cores with a capacity of 2.5Gbps. Select this license
type when installing the Medium .OVAfile.
NOTE: The Extreme Management Center evaluation license provides access for up to 10 of each
license type until the evaluation expiration date. To purchase additional licenses, contact
your Extreme Networks sales representative.
7. Select the Analytics Engine to which the Virtual Sensor sends flow data.
8. Click the ellipsis button ( ) in the Management Interface Network field and select
the network you use for management,
The Virtual Sensor must communicate with the Extreme Management Center server
and the ExtremeAnalytics engine using this network.
9. Click the ellipsis button ( ) in the Monitored Interface Port Group field and select
the port group for the monitoring interface.
The port group must be on the distributed virtual switch you are monitoring.
IMPORTANT: Select a port group that does not include an uplink port.
10. Change the Name of the Virtual Sensor, if desired.
NOTE: By default, the Virtual Sensor is named using the following format: <IP Address of
host><PortGroupName>-VS.
11. Select Use DHCP, if using a DHCP server to dynamically assign an IPaddress for the
Virtual Sensor.
12. Enter an IP Address and Default Gateway for the Virtual Sensor if you are not using
DHCP.