
User's Guide
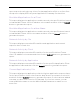
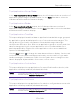
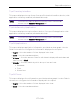
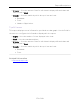
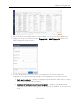
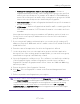
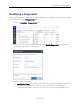
Table Of Contents
- ExtremeAnalytics® User GuideVersion 8.4
- Legal Notices
- Trademarks
- Contact
- Extreme Networks® Software License Agreement
- Table of Contents
- ExtremeAnalytics™ Help
- ExtremeAnalytics Licensing
- Configuring Enhanced Netflow for Extreme Analytics and Extreme Wireless Contr...
- How to Deploy ExtremeAnalytics in an MSP or MSSP Environment
- ExtremeAnalytics Tab Overview
- ExtremeAnalytics Dashboard Overview
- ExtremeAnalytics Insights Dashboard
- ExtremeAnalytics Tracked Applications Dashboard
- ExtremeAnalytics Browser Overview
- ExtremeAnalytics Application Flows
- ExtremeAnalytics Fingerprints Overview
- ExtremeAnalytics Custom Fingerprints
- Delete Custom Fingerprints
- Custom Fingerprint Examples
- Create Custom Fingerprints Based on Flow
- Create Custom Fingerprints Based on Destination Address
- Create Custom Fingerprints Based on Application or Application Group
- ExtremeAnalytics Packet Captures
- ExtremeAnalytics Configuration Overview
- Virtual Sensors
- ExtremeAnalytics Engine Advanced Configuration
- Flow Collection Type
- Collection Privacy Levels
- Client Aggregation
- Slow Client Data
- Max End-Systems in Hourly Details
- Sensor Log Levels
- Store Application Site Data
- ExtremeControl Integration
- Flow Sources/Application Telemetry Sources
- Web Credentials
- Configuration Properties
- Sensor Modules
- Auditing
- Network Settings
- ExtremeAnalytics Reports
- ExtremeAnalytics Report Descriptions
- Report Descriptions
- Analytics Events
- Bandwidth for a Client Over Time
- Interface Top Applications Treemap
- Sites Using the Most Bandwidth
- Most Popular Applications
- Most Used Applications for a Client
- Most Used Applications for a User Name
- Network Activity by Site
- Network Activity by Client
- Network Activity by Application
- Slowest Applications by Site
- Top Applications Group Radar
- Top Applications Radar
- Top Applications TreeMap
- Top Applications for Interface
- Top Applications for Server
- Top Clients by Interface
- Top Interfaces by Application
- Top N Applications
- Top N Clients
- Top N Servers
- Report Descriptions
- Add and Modify Fingerprints
- Add Fingerprints
- Enable or Disable Fingerprints
- Modify Fingerprints
- Update Fingerprints
- Custom Fingerprint Examples
- How to Deploy ExtremeAnalytics in an MSP or MSSP Environment
- ExtremeAnalytics Virtual Sensor Configuration in Extreme Management Center
- Stream Flow Data from ExtremeAnalytics into Splunk
- Stream Flow Data from ExtremeAnalytics into Elastic Stack

Report Descriptions
152 of 218
Top Applications Group Radar
In the Top Applications Group Radar report, the info bar provides an overview of
application group usage in a radar format. Use the Start calendar to select the
start date and time and the format to display.
Top Applications Radar
In the Top Applications Radar report, the info bar provides an overview of
application usage in a radar format. Use the Start calendar to select the start date
and time and the format to display.
Top Applications TreeMap
This report displays hierarchical data on application bandwidth usage, grouped
by application group and displayed in sets of colored nested rectangles. This
design allows you to easily see patterns of bandwidth usage that might
otherwise be difficult to spot. Click on an application group to zoom in and view
data for that group. Hover over an application cell to view bandwidth for a
particular application. Right-click on an application cell to access additional
reports for that application.
Use the Gear button to change the start date and time to display. Set the scale
to Linear to view the data scaled proportionately; set the scale to Log to make
smaller rectangles of data more visible. Use the combo box to change how the
data is displayed: by bandwidth, client count, or flow count.
Top Applications for Interface
This report displays the top applications for a specified interface (device) with
application telemetry enabled (wildcards allowed).
NOTE: You need to first enable the application telemetry feature on ExtremeXOS
switches from the Analytics > Configuration tab.
Top Applications for Server
This report displays the top applications for a device configured as a server with
application telemetry enabled (wildcards allowed).
NOTE: You need to first enable the application telemetry feature on ExtremeXOS
switches from the
Analytics > Configuration tab.