
User's Guide
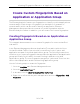


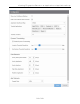
Table Of Contents
- ExtremeAnalytics® User GuideVersion 8.4
- Legal Notices
- Trademarks
- Contact
- Extreme Networks® Software License Agreement
- Table of Contents
- ExtremeAnalytics™ Help
- ExtremeAnalytics Licensing
- Configuring Enhanced Netflow for Extreme Analytics and Extreme Wireless Contr...
- How to Deploy ExtremeAnalytics in an MSP or MSSP Environment
- ExtremeAnalytics Tab Overview
- ExtremeAnalytics Dashboard Overview
- ExtremeAnalytics Insights Dashboard
- ExtremeAnalytics Tracked Applications Dashboard
- ExtremeAnalytics Browser Overview
- ExtremeAnalytics Application Flows
- ExtremeAnalytics Fingerprints Overview
- ExtremeAnalytics Custom Fingerprints
- Delete Custom Fingerprints
- Custom Fingerprint Examples
- Create Custom Fingerprints Based on Flow
- Create Custom Fingerprints Based on Destination Address
- Create Custom Fingerprints Based on Application or Application Group
- ExtremeAnalytics Packet Captures
- ExtremeAnalytics Configuration Overview
- Virtual Sensors
- ExtremeAnalytics Engine Advanced Configuration
- Flow Collection Type
- Collection Privacy Levels
- Client Aggregation
- Slow Client Data
- Max End-Systems in Hourly Details
- Sensor Log Levels
- Store Application Site Data
- ExtremeControl Integration
- Flow Sources/Application Telemetry Sources
- Web Credentials
- Configuration Properties
- Sensor Modules
- Auditing
- Network Settings
- ExtremeAnalytics Reports
- ExtremeAnalytics Report Descriptions
- Report Descriptions
- Analytics Events
- Bandwidth for a Client Over Time
- Interface Top Applications Treemap
- Sites Using the Most Bandwidth
- Most Popular Applications
- Most Used Applications for a Client
- Most Used Applications for a User Name
- Network Activity by Site
- Network Activity by Client
- Network Activity by Application
- Slowest Applications by Site
- Top Applications Group Radar
- Top Applications Radar
- Top Applications TreeMap
- Top Applications for Interface
- Top Applications for Server
- Top Clients by Interface
- Top Interfaces by Application
- Top N Applications
- Top N Clients
- Top N Servers
- Report Descriptions
- Add and Modify Fingerprints
- Add Fingerprints
- Enable or Disable Fingerprints
- Modify Fingerprints
- Update Fingerprints
- Custom Fingerprint Examples
- How to Deploy ExtremeAnalytics in an MSP or MSSP Environment
- ExtremeAnalytics Virtual Sensor Configuration in Extreme Management Center
- Stream Flow Data from ExtremeAnalytics into Splunk
- Stream Flow Data from ExtremeAnalytics into Elastic Stack

Creating Fingerprints Based on an Application or Application Group
130 of 218
Show Low Confidence Matches
Check the box to display flows for which Extreme Management Center has low
confidence.
Hide Local Collector When Unused
Check the box to hide local collector information when not in use.
Application Dashboard Map
Select from the drop-down list the map from which to draw application dashboard
data.
Tracked Applications
Select the applications to track in the ExtremeAnalytics tab.
Tracked Sites
Select the sites to track on the ExtremeAnalytics tab. Tracked sites are also indicated
on the Network > Devices > Sites > Endpoint Locations tab in the right panel.
Dynamic Thresholding
Use the Dynamic Thresholding section of the window to indicate whether to enable
dynamic threshold functionality for the Network Service and Tracked Applications
dashboards.
When this functionality is enabled, the expected range for application response time
is calculated based on past observed response times and a dynamic threshold is
assigned. An alarm occurs when any network service or tracked application has a
response time measured above its dynamic threshold.
The sliders allow you to adjust the sensitivity of the dynamic threshold by increasing
or decreasing the size of the expected response time range. Selecting a lower
sensitivity means more time is required for an alarm to occur. Alarms are displayed
on the Alarms & Events > Alarms tab.
Data Retention
Use this section of the tab to configure the amount of time Extreme Management
Center saves flow data.
App Telemetry
This section allows you to configure the default sample rate ExtremeAnalytics uses
when configuring ExtremeXOS devices on which Application Telemetry is enabled.