
Installation Guide
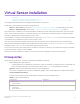
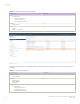
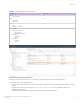


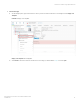
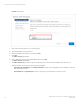

Table Of Contents

Virtual Sensor installation using vSphere Web Client
This section provides information about the Virtual Sensor deployment architecture and steps for installing Virtual Sensor using vSphere
Web Client.
Deployment architecture
The image below shows a typical Virtual Sensor deployment on a VMware ESXi hypervisor:
FIGURE 1 Deployment architecture
Application VMs
vSensor VM
dvSwitch
XMC
MGMT
Packets and
IPFIX
Metadata
IPFIX
Metadata
(Optional)
Egress
Flows/Packets
Egress Tunnel
(optional)
Ingress Tunnel
to vSensor (optional)
Mirrored
Flows/Packets
East-West
Traffic
Test Traffic
Rx Tx MGMT vNIC
IPFIX vNIC
Test-vNIC
1. Packet Processing Ports
2. DPDK binds Rx/Tx ports.
3. Ports not to be used for IPFIX export.
vNIC-3
vNIC-1 vNIC-2
vNIC-5
vNIC-4
Virtual Sensor is based on CentOS 7.2 and DPDK, and deployed using VMware vSphere-based OVA image.
The Virtual Sensor OVA image is precongured with ve vNICs: Rx (for receiving ingress packets), Tx (for sending packets post-
processing), Test (for sending test packets), IPFIX Export (for exporting IPFIX metadata), and Management.
• The Rx vNIC and Test vNIC should be in a port group on the dvSwitch you wish to monitor.
• The Tx vNIC, Management vNIC, and IPFIX vNIC should be in the same network. This must be a network that can access the
XMC and Analytics appliances.
• To monitor trac from multiple switches, one instance of Virtual Sensor must be deployed per switch, since the Rx vNIC cannot
be part of multiple switches at the same time.
• When added as a ow source to an ExtremeAnalytics engine, Virtual Sensor forwards the rst few packets of each ow over a
GRE tunnel to the ExtemeAnalytics engine and sends ow metadata in the form of IPFIX records to the engine over the
network.
Virtual Sensor installation using vSphere Web Client
ExtremeAnalytics Virtual Sensor 1.0.0 Software Installation Guide
9036611-00 15