
User's Guide

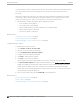

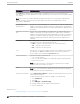
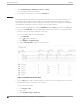
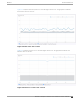
Table Of Contents
- Table of Contents
- Preface
- Welcome to Extreme Campus Controller
- Dashboard
- Monitor
- Sites List
- Device List
- Access Points List
- Smart RF Widgets
- Switches List
- Networks List
- Clients
- Policy
- Configure
- Network Configuration Steps
- Sites
- Add a Site
- Modifying Site Configuration
- Site Location
- Adding Device Groups to a Site
- Add or Edit a Configuration Profile
- Associated Profiles
- Associated Networks
- Mesh Point Profile Configuration
- Configure Client Bridge
- Understand Radio Mode
- Radio as a Sensor
- Advanced AP Radio Settings
- VLAN Profile Settings
- AirDefense Profile Settings
- ExtremeLocation Profile Settings
- IoT Profile Settings
- Positioning Profile Settings
- Analytics Profile Settings
- RTLS Settings
- Advanced Configuration Profile Settings
- Configuring RF Management
- Configuring a Floor Plan
- Advanced Tab
- Devices
- Networks
- Policy
- Automatic Adoption
- ExtremeGuest Integration
- AAA RADIUS Authentication
- Onboard
- Onboard AAA Authentication
- Manage Captive Portal
- Manage Access Control Groups
- Access Control Rules
- Tools
- Administration
- System Configuration
- Manage Administrator Accounts
- Extreme Campus Controller Applications
- Product License
- Glossary
- Index

Figure 32 compares Round Trip Times for selected targets within a site. The grayed area indicates
the baseline values for the site.
Figure 32: RTT in the Site Context
Figure 33 compares Packet Loss for selected targets within a site. The grayed area indicates the
baseline values for the site.
Figure 33: Packet Loss in the Site Context
Monitor
Access Points List
Extreme Campus Controller User Guide for version 5.46.03 89