
User's Guide


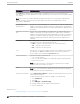
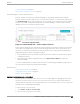
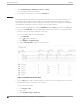
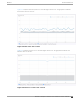
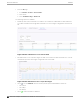
Table Of Contents
- Table of Contents
- Preface
- Welcome to Extreme Campus Controller
- Dashboard
- Monitor
- Sites List
- Device List
- Access Points List
- Smart RF Widgets
- Switches List
- Networks List
- Clients
- Policy
- Configure
- Network Configuration Steps
- Sites
- Add a Site
- Modifying Site Configuration
- Site Location
- Adding Device Groups to a Site
- Add or Edit a Configuration Profile
- Associated Profiles
- Associated Networks
- Mesh Point Profile Configuration
- Configure Client Bridge
- Understand Radio Mode
- Radio as a Sensor
- Advanced AP Radio Settings
- VLAN Profile Settings
- AirDefense Profile Settings
- ExtremeLocation Profile Settings
- IoT Profile Settings
- Positioning Profile Settings
- Analytics Profile Settings
- RTLS Settings
- Advanced Configuration Profile Settings
- Configuring RF Management
- Configuring a Floor Plan
- Advanced Tab
- Devices
- Networks
- Policy
- Automatic Adoption
- ExtremeGuest Integration
- AAA RADIUS Authentication
- Onboard
- Onboard AAA Authentication
- Manage Captive Portal
- Manage Access Control Groups
- Access Control Rules
- Tools
- Administration
- System Configuration
- Manage Administrator Accounts
- Extreme Campus Controller Applications
- Product License
- Glossary
- Index

3. Select Troubleshooting > AP Remote Console > Connect.
The selected AP's SSH console appears.
4. To terminate the SSH console session, select Disconnect.
Smart Poll
Smart Poll provides reports that help you determine the health of the connection between an access
point and any valid IP address target or valid Fully-Qualified Domain Name (FQDN). Link stability is
determined by Round Trip Time ( RTT) and packet loss statistics. Smart Poll evaluates the link between
an individual AP and Extreme Campus Controller or any user defined target.
Smart Poll reports are available from the main Dashboard, from the Sites page, and from the AP page:
• From the main Dashboard. The Dashboard widget compares sites based on the average RTT and
Packet Loss stats for all targets and all APs in each site.
To access the Dashboard Poll Sites Stats widget:
1. Go to Dashboard.
2. Select to edit the dashboard.
3. Select Widgets > Troubleshooting.
4. Drag the Poll Sites Stats widget onto the Dashboard.
Figure 31: Dashboard Poll Site Stats
• From the Sites page. Charts compare mean RTT or Packet Loss across all targets in the selected site
with quantitative RTT or Packet Loss across all sites.
To access the sites poll data:
1. Go to Monitor > Sites.
2. Select a site.
3. Select Troubleshooting > Smart Poll.
Access Points List
Monitor
88 Extreme Campus Controller User Guide for version 5.46.03