
User's Guide
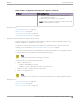
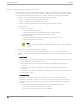
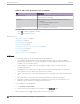
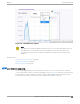
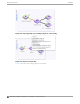
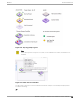
Table Of Contents
- Table of Contents
- Preface
- Welcome to Extreme Campus Controller
- Dashboard
- Monitor
- Sites List
- Device List
- Access Points List
- Smart RF Widgets
- Switches List
- Networks List
- Clients
- Policy
- Configure
- Network Configuration Steps
- Sites
- Add a Site
- Modifying Site Configuration
- Site Location
- Adding Device Groups to a Site
- Add or Edit a Configuration Profile
- Associated Profiles
- Associated Networks
- Mesh Point Profile Configuration
- Configure Client Bridge
- Understand Radio Mode
- Radio as a Sensor
- Advanced AP Radio Settings
- VLAN Profile Settings
- AirDefense Profile Settings
- ExtremeLocation Profile Settings
- IoT Profile Settings
- Positioning Profile Settings
- Analytics Profile Settings
- RTLS Settings
- Advanced Configuration Profile Settings
- Configuring RF Management
- Configuring a Floor Plan
- Advanced Tab
- Devices
- Networks
- Policy
- Automatic Adoption
- ExtremeGuest Integration
- AAA RADIUS Authentication
- Onboard
- Onboard AAA Authentication
- Manage Captive Portal
- Manage Access Control Groups
- Access Control Rules
- Tools
- Administration
- System Configuration
- Manage Administrator Accounts
- Extreme Campus Controller Applications
- Product License
- Glossary
- Index

Figure 25: 6 GHz Band Throughput
Note
The datasets are sampled at dierent intervals. Therefore, it is possible that data from the 14-
day dataset will not include data from the 3-day dataset or from the 3-hour dataset. It is
possible that a new client will not appear in a dataset if the dataset has not been recently
updated.
Related Topics
LLDP Switch Port Connectivity on page 77
Add a New Dashboard on page 33
Modify a Dashboard on page 34
NEW!
LLDP Switch Port Connectivity
The Topology diagram displays the selected AP port connection to one or more switches, which are
connected to Extreme Campus Controller. The diagram (shown in Figure 26) represents the relationship
between an AP, a switch, and Extreme Campus Controller, displaying the link speed between the AP
ports and the switch ports, and connection status with Extreme Campus Controller.
Monitor
Access Points List
Extreme Campus Controller User Guide for version 5.46.03 77