
User's Guide
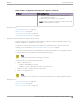
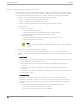
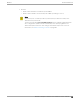
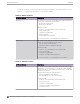
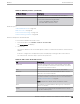
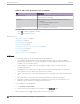
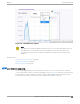
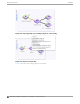
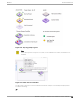
Table Of Contents
- Table of Contents
- Preface
- Welcome to Extreme Campus Controller
- Dashboard
- Monitor
- Sites List
- Device List
- Access Points List
- Smart RF Widgets
- Switches List
- Networks List
- Clients
- Policy
- Configure
- Network Configuration Steps
- Sites
- Add a Site
- Modifying Site Configuration
- Site Location
- Adding Device Groups to a Site
- Add or Edit a Configuration Profile
- Associated Profiles
- Associated Networks
- Mesh Point Profile Configuration
- Configure Client Bridge
- Understand Radio Mode
- Radio as a Sensor
- Advanced AP Radio Settings
- VLAN Profile Settings
- AirDefense Profile Settings
- ExtremeLocation Profile Settings
- IoT Profile Settings
- Positioning Profile Settings
- Analytics Profile Settings
- RTLS Settings
- Advanced Configuration Profile Settings
- Configuring RF Management
- Configuring a Floor Plan
- Advanced Tab
- Devices
- Networks
- Policy
- Automatic Adoption
- ExtremeGuest Integration
- AAA RADIUS Authentication
- Onboard
- Onboard AAA Authentication
- Manage Captive Portal
- Manage Access Control Groups
- Access Control Rules
- Tools
- Administration
- System Configuration
- Manage Administrator Accounts
- Extreme Campus Controller Applications
- Product License
- Glossary
- Index

Table 14: Tabs on the AP Details Screen (continued)
Tab Description
Troubleshooting Oers packet capture at the AP, remote console access to the
AP, and Smart Poll reporting.
Smart RF View widgets that show information about the following:
• Mitigation
• Occupancy and neighbor channels
• Peer AP visibility.
Certificate Current credentials in use by the AP.
3. You can also:
Select to modify configuration settings.
Select
to go back to the list.
Related Topics
AP Tunnel Information on page 81
AP Widgets on page 76
Smart RF Widgets on page 91
Sites Overview on page 19
Opening Live SSH Console to a Selected AP on page 87
Packet Capture on page 83
Floor Plans on page 24
Global Client Access Lists on page 106
AP Widgets
The following widget reports are available from the AP dashboard:
• Topology/Map. Toggle between a topology diagram and a floor map. The Topology diagram
represents the AP switch port connection information. The Map diagram indicates where the AP is
installed on an associated floor plan.
• Device Utilization. Provides metrics on throughput and data usage for each AP and clients
associated with the AP.
• RF Management. Provides metrics on radio frequency quality, channel utilization, channel noise,
load, signal to noise ratio (SNR) levels, and client retry statistics.
• Clients. Provides metrics on client distribution by protocol, operating system, and manufacturer per
AP.
• Expert: AP metrics for the expert user related to RFQI, RTT, RSS, and RX and TX Rates.
• Application Visibility. Provides details about applications the client is accessing and metrics on
application groups related to throughput and usage per AP.
To view widgets for an individual AP:
1. Go to Devices > Access Points.
2. Select an AP from the list and review the widgets on the Dashboard page.
Filter by radio band. Select
to display data for a specific radio band.
Access Points List
Monitor
76 Extreme Campus Controller User Guide for version 5.46.03