
User's Guide
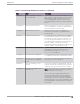
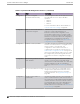
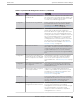
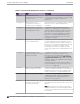
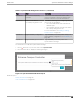

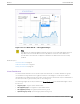

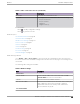
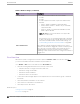
Table Of Contents
- Table of Contents
- Preface
- Welcome to Extreme Campus Controller
- Dashboard
- Monitor
- Sites List
- Device List
- Access Points List
- Smart RF Widgets
- Switches List
- Networks List
- Clients
- Policy
- Configure
- Network Configuration Steps
- Sites
- Add a Site
- Modifying Site Configuration
- Site Location
- Adding Device Groups to a Site
- Add or Edit a Configuration Profile
- Associated Profiles
- Associated Networks
- Mesh Point Profile Configuration
- Configure Client Bridge
- Understand Radio Mode
- Radio as a Sensor
- Advanced AP Radio Settings
- VLAN Profile Settings
- AirDefense Profile Settings
- ExtremeLocation Profile Settings
- IoT Profile Settings
- Positioning Profile Settings
- Analytics Profile Settings
- RTLS Settings
- Advanced Configuration Profile Settings
- Configuring RF Management
- Configuring a Floor Plan
- Advanced Tab
- Devices
- Networks
- Policy
- Automatic Adoption
- ExtremeGuest Integration
- AAA RADIUS Authentication
- Onboard
- Onboard AAA Authentication
- Manage Captive Portal
- Manage Access Control Groups
- Access Control Rules
- Tools
- Administration
- System Configuration
- Manage Administrator Accounts
- Extreme Campus Controller Applications
- Product License
- Glossary
- Index

• Download Usage by Group. Download usage by defined user group.
• Unique Users by Group. Number of unique users by defined user group.
• Concurrent Users by Group. Number of simultaneous connections by defined user group.
Note
Aggregate data crosses a High Availability Pair.
Use the Extreme Campus Controller Report Generator to generate the same Venue reports in PDF
format. Generated reports can be downloaded and scheduled using Scheduler for Extreme Campus
Controller.
To generate customer-defined reports, go to Tools > Reports > Templates.
Related Topics
Define Venue User Groups on page 344
Reports on page 342
Create Report Template on page 343
SP Identification on page 234
Scheduler for Extreme Campus Controller on page 388
Network Snapshot: Sites
To view network details from the Sites screen:
1. Go to Monitor > Sites and select a site.
The Site Dashboard displays.
2. Select any of the tabs described in the following table.
Table 7: Tabs on the Sites Screen
Tab Description
Dashboard Customer-defined reports based on site statistics and venue-
specific user groups:
• Default tab displays network metrics for the site.
• Venue tab displays customer-defined reports generated for
venue-specific user groups.
Networks Lists the network services associated with the site. Select a
network to display network details.
Access Points List of access points associated with the site. For more
information, see:
• AP Actions on page 186
• Radio Settings Button on page 49
Switches List of switches associated with the site.
Clients List of clients associated with the site.
Troubleshooting Oers packet capture at the AP, remote console access to the
AP, and Smart Poll reporting.
Network Snapshot: Sites Monitor
48 Extreme Campus Controller User Guide for version 5.46.03