
User's Guide

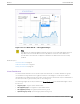

Table Of Contents
- Table of Contents
- Preface
- Welcome to Extreme Campus Controller
- Dashboard
- Monitor
- Sites List
- Device List
- Access Points List
- Smart RF Widgets
- Switches List
- Networks List
- Clients
- Policy
- Configure
- Network Configuration Steps
- Sites
- Add a Site
- Modifying Site Configuration
- Site Location
- Adding Device Groups to a Site
- Add or Edit a Configuration Profile
- Associated Profiles
- Associated Networks
- Mesh Point Profile Configuration
- Configure Client Bridge
- Understand Radio Mode
- Radio as a Sensor
- Advanced AP Radio Settings
- VLAN Profile Settings
- AirDefense Profile Settings
- ExtremeLocation Profile Settings
- IoT Profile Settings
- Positioning Profile Settings
- Analytics Profile Settings
- RTLS Settings
- Advanced Configuration Profile Settings
- Configuring RF Management
- Configuring a Floor Plan
- Advanced Tab
- Devices
- Networks
- Policy
- Automatic Adoption
- ExtremeGuest Integration
- AAA RADIUS Authentication
- Onboard
- Onboard AAA Authentication
- Manage Captive Portal
- Manage Access Control Groups
- Access Control Rules
- Tools
- Administration
- System Configuration
- Manage Administrator Accounts
- Extreme Campus Controller Applications
- Product License
- Glossary
- Index

Figure 13: Select Radio Bands — Throughput Widget
Note
The datasets are sampled at dierent intervals. Therefore, it is possible that data from the 14-
day dataset will not include data from the 3-day dataset or from the 3-hour dataset. It is
possible that a new client will not appear in a dataset if the dataset has not been recently
updated.
Related Topics
Venue Dashboard on page 47
Add a New Dashboard on page 33
Modify a Dashboard on page 34
Venue Dashboard
The Venue Dashboard oers venue-specific reports that are based on customer-defined user groups.
Use the Network Usage, Network Throughput, and Client Count widgets to create reports that are
categorized by user-defined user groups. Define user groups that contain the Hotspot 2.0 NAI Realm of
the service provider, or group users by SSID or client user group.
The following widget reports are provided on the Venue Dashboard. These dashboard widgets cannot
be removed.
• Usage by Type. Usage for uplink and downlink.
• Throughput by Type. Throughput for uplink and downlink.
• Throughput by Group. Throughput per defined user group.
• Upload Usage by Group. Upload usage by defined user group.
Monitor
Venue Dashboard
Extreme Campus Controller User Guide for version 5.46.03 47