
User's Guide
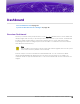
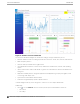
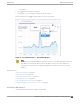

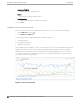
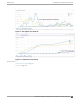
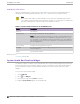
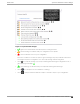
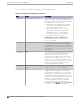
Table Of Contents
- Table of Contents
- Preface
- Welcome to Extreme Campus Controller
- Dashboard
- Monitor
- Sites List
- Device List
- Access Points List
- Smart RF Widgets
- Switches List
- Networks List
- Clients
- Policy
- Configure
- Network Configuration Steps
- Sites
- Add a Site
- Modifying Site Configuration
- Site Location
- Adding Device Groups to a Site
- Add or Edit a Configuration Profile
- Associated Profiles
- Associated Networks
- Mesh Point Profile Configuration
- Configure Client Bridge
- Understand Radio Mode
- Radio as a Sensor
- Advanced AP Radio Settings
- VLAN Profile Settings
- AirDefense Profile Settings
- ExtremeLocation Profile Settings
- IoT Profile Settings
- Positioning Profile Settings
- Analytics Profile Settings
- RTLS Settings
- Advanced Configuration Profile Settings
- Configuring RF Management
- Configuring a Floor Plan
- Advanced Tab
- Devices
- Networks
- Policy
- Automatic Adoption
- ExtremeGuest Integration
- AAA RADIUS Authentication
- Onboard
- Onboard AAA Authentication
- Manage Captive Portal
- Manage Access Control Groups
- Access Control Rules
- Tools
- Administration
- System Configuration
- Manage Administrator Accounts
- Extreme Campus Controller Applications
- Product License
- Glossary
- Index

Application Visibility
Provides application visibility metrics.
System
System metrics indicate network health.
Troubleshooting
Provides a packet capture list and Poll site statistics.
4. Select Save.
Utilization Stats by Network SSID
Extreme Campus Controller oers dashboard reports that you can use to compare network usage.
1. Go to Dashboard and select .
2. Select Widgets > Utilization.
The following Utilization widgets display data for multiple networks:
• Clients per Network
• Throughput per Network
• Utilization per Network
These widgets have the capability to check or clear the time series to be shown. By default, a minimized
widget shows the first 10 time series with the legend displaying a checked mark. When the widget is
expanded, all the checked time series are displayed with the full legend displayed. Users can select up
to 10 SSIDs, clearing SSIDs as required. Select each line on the graph to display a tool tip that includes
the network SSID for easy identification.
Figure 8: Clients per Network
Utilization Stats by Network SSID
Dashboard
36 Extreme Campus Controller User Guide for version 5.46.03