
User's Guide
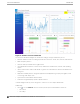
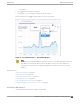

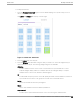
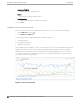
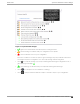
Table Of Contents
- Table of Contents
- Preface
- Welcome to Extreme Campus Controller
- Dashboard
- Monitor
- Sites List
- Device List
- Access Points List
- Smart RF Widgets
- Switches List
- Networks List
- Clients
- Policy
- Configure
- Network Configuration Steps
- Sites
- Add a Site
- Modifying Site Configuration
- Site Location
- Adding Device Groups to a Site
- Add or Edit a Configuration Profile
- Associated Profiles
- Associated Networks
- Mesh Point Profile Configuration
- Configure Client Bridge
- Understand Radio Mode
- Radio as a Sensor
- Advanced AP Radio Settings
- VLAN Profile Settings
- AirDefense Profile Settings
- ExtremeLocation Profile Settings
- IoT Profile Settings
- Positioning Profile Settings
- Analytics Profile Settings
- RTLS Settings
- Advanced Configuration Profile Settings
- Configuring RF Management
- Configuring a Floor Plan
- Advanced Tab
- Devices
- Networks
- Policy
- Automatic Adoption
- ExtremeGuest Integration
- AAA RADIUS Authentication
- Onboard
- Onboard AAA Authentication
- Manage Captive Portal
- Manage Access Control Groups
- Access Control Rules
- Tools
- Administration
- System Configuration
- Manage Administrator Accounts
- Extreme Campus Controller Applications
- Product License
- Glossary
- Index

Figure 4: Default Overview Dashboard
The Overview dashboard widgets are classified according to the type of data they access:
• Network utilization metrics including top and bottom values for clients, APs, switches, and networks
• Radio Frequency metrics
• Switches with top and bottom throughput levels
• Client distribution and client count for the top and bottom manufacturer, network, and operating
system
• Captive Portal metrics that include details on guests associated with the network and dwell time for
each guest
• Application Visibility metrics categorize applications and application groups by throughput, client
count, usage, and unique users
• System metrics that indicate network health.
• Troubleshooting that displays packet capture instances.
Combine widgets from any of the categories to create one or more unique dashboards.
Additionally:
•
Select
to set the Duration value for the time period reported. Valid duration values are:
◦ Last 3 hours
◦ Last 3 days
Overview Dashboard
Dashboard
32 Extreme Campus Controller User Guide for version 5.46.03