
User's Guide
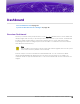
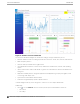
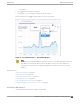

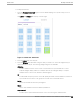
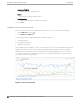
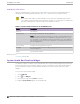
Table Of Contents
- Table of Contents
- Preface
- Welcome to Extreme Campus Controller
- Dashboard
- Monitor
- Sites List
- Device List
- Access Points List
- Smart RF Widgets
- Switches List
- Networks List
- Clients
- Policy
- Configure
- Network Configuration Steps
- Sites
- Add a Site
- Modifying Site Configuration
- Site Location
- Adding Device Groups to a Site
- Add or Edit a Configuration Profile
- Associated Profiles
- Associated Networks
- Mesh Point Profile Configuration
- Configure Client Bridge
- Understand Radio Mode
- Radio as a Sensor
- Advanced AP Radio Settings
- VLAN Profile Settings
- AirDefense Profile Settings
- ExtremeLocation Profile Settings
- IoT Profile Settings
- Positioning Profile Settings
- Analytics Profile Settings
- RTLS Settings
- Advanced Configuration Profile Settings
- Configuring RF Management
- Configuring a Floor Plan
- Advanced Tab
- Devices
- Networks
- Policy
- Automatic Adoption
- ExtremeGuest Integration
- AAA RADIUS Authentication
- Onboard
- Onboard AAA Authentication
- Manage Captive Portal
- Manage Access Control Groups
- Access Control Rules
- Tools
- Administration
- System Configuration
- Manage Administrator Accounts
- Extreme Campus Controller Applications
- Product License
- Glossary
- Index

Dashboard
Overview Dashboard on page 31
System Health Best Practice Widget on page 38
Overview Dashboard
Monitor your network activity and performance on the Overview dashboard. The Overview dashboard
displays widgets that can help you proactively monitor and troubleshoot your network. The dashboard
provides a graphical representation of information related to devices, clients, and network trac.
Depending on the report, the widget represents historical data or a combination of historical and the
latest data from shared memory.
Note
Historical data is persistent after system restarts and software upgrades, but not if the system
is restored to the factory defaults or from a backup.
Extreme Campus Controller is installed with a Default dashboard. You can customize the default
dashboard and add additional dashboards with custom layouts and a unique set of widgets. The
maximum number of supported dashboards is 10. The free-form dashboard can have a maximum of 10
widgets.
Extreme Campus Controller User Guide for version 5.46.03
31