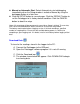
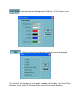
: Set the color for Background, Grid Axis, X/Y/Z values, and
Vector Sum.
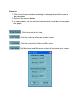
: Click to select the parameters and Axis to be displayed
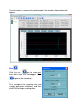
The field at the bottom of the graph window will display the Data Point
Number, Time, and X/Y/Z/Vector Sum value at the cursor location.