
User`s manual

11 Working with plots
General
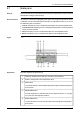
A temperature plot can be regarded as a graph that displays how the temperatures
vary relative to time in a sequence file.
NOTE
This procedure assumes that you have connected to a camera and that a live or
recorded image is visible in the image window.
Procedure
Follow this procedure:
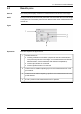
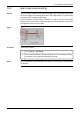
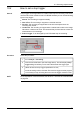
Lay out a measurement tool in the image.1
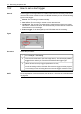
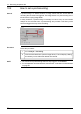
Right-click the measurement tool, select Plot and the measurement type
that you want to plot (typically max., min., or average temperature). A plot
will now be displayed.
2
At this stage, you may want to do one of the following:
■
Copy the plot as a picture and paste it into a technical report, a white
paper, etc.
■
Copy the plot as a *.csv file.
■
Export the plot as a picture.
■
Export the plot as data.
3
NOTE
■
For an explanation of screen elements, see section 9 – Overview of screen elements
on page 25.
■
For an explanation of how to locate files, see section 8.5 – Locating images or
sequence files on page 23.
■
For an explanation of how to record a sequence file, see section 10 – Recording
sequence files on page 48.
■
For an explanation of how export images and data, see section 13 – Exporting
data on page 55.
Publ. No. T559132 Rev. a449 – ENGLISH (EN) – April 21, 2010 53