
User`s manual

9.8 Results pane
General
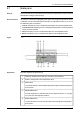
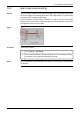
The results pane displays results from measurement tools laid out in the image.
NOTE
The figure below shows the results pane when a line has been laid out in the image
or sequence file. The results pane will look different when other measurement tools
are laid out.
Figure
T638293;a1
Explanation
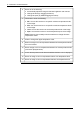
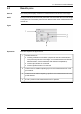
This table explains the figure above:
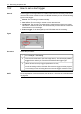
Toolbar buttons for:
■
Creating a difference calculation (requires at least two measurement
tools previously laid out in the image, or one measurement tool with two
different results, such as maximum and minimum temperature).
■
Create a plot window on a new tab.
■
Create a profile window on a new tab.
1
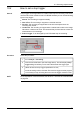
Check boxes to enable outputting a plot for this measurement tool in the
plot window.
2
Check boxes to enable outputting a profile for this measurement tool in the
profile window.
3
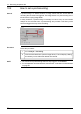
X and Y position of the measurement tool in question.4
Publ. No. T559132 Rev. a449 – ENGLISH (EN) – April 21, 2010 47
9 – Overview of screen elements