
User`s manual
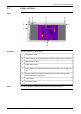
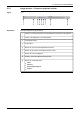
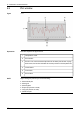
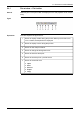
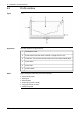
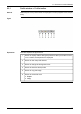

9.4.1 Plot window > Plot toolbar
General
Diffferent parts of the plot toolbar are displayed in live and playback mode, respec-
tively.
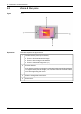
Figure
T630422;a2
Explanation
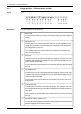
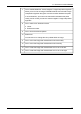
This table explains the figure above:
Button to display markers along the plot line. When you hold the cursor
over a marker, the temperature is displayed.
1
Button to display a cursor along the plot line.2
Button to clear the plot window.3
Button to change the background color.4
Button to show the whole plot.5
Button to save the plot in *.plot file format.6
Button to access file tools:
■
Open
■
Save
■
Save as
■
Export
■
Copy
7
Publ. No. T559132 Rev. a449 – ENGLISH (EN) – April 21, 2010 41
9 – Overview of screen elements