
User`s manual
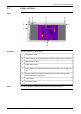
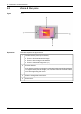

9.4 Plot window
Figure
T630408;a1
Explanation
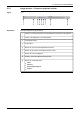
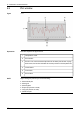
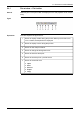
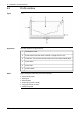
This table explains the figure above:
Temperature scale.1
Plot number.2
Plot line. You can have several plot lines in the same plot window. In play-
back mode, the red line indicates the current position in the sequence file.
3
Close button.4
Time scale.5
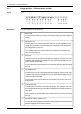
Plot toolbar.6
NOTE
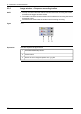
Right-clicking the plot lets you do the following:
■
Show whole plot.
■
Show grid.
■
Show legend.
■
Export (as pictures or data).
■
Copy (as pictures or data).
■
Delete the plot.
40 Publ. No. T559132 Rev. a449 – ENGLISH (EN) – April 21, 2010
9 – Overview of screen elements