
User`s manual

9.3.1 Image window > Measurement toolbar
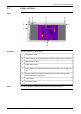
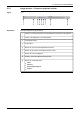
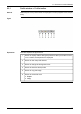
Figure
T630406;a3
Explanation
This table explains the figure above:
Select tool.
You use this tool when you want to move spots, areas, and lines within an
image.
1
Spotmeter tool.
You use this tool to create a spotmeter that you can put anywhere on the
image. The spotmeter and the temperature it displays will be stored with
the image when you save it.
To move the spotmeter, use the Select tool to select the spotmeter tool,
then click-drag the tool.
2
Area tool.
You use this tool to click-and-drag within the image to create an area. The
minimum and maximum temperatures in the area will be displayed in the
measurement results table.
To move the area, use the Select tool to select the area tool, then click-drag
the tool.
3
Circle/ellipse tool.
You use this tool to click-and-drag within the image to create a circle. The
minimum and maximum temperatures in the area will be displayed in the
measurement results table.
To move the circle, use the Select tool to select the circle tool, then click-
drag the tool.
4
Line/polyline tool.
You use this tool to create a line within the image. The minimum and maxi-
mum temperatures along the line will be displayed in the measurement re-
sults table.
To move the line, use the Select tool to select the line tool, then click-drag
the tool.
5
Show/hide overlay graphics tool.
You use this tool to display and hide the overlay graphics that are associated
with the image from the infrared camera.
6
36 Publ. No. T559132 Rev. a449 – ENGLISH (EN) – April 21, 2010
9 – Overview of screen elements