
User`s manual
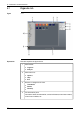

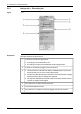

Zoom & Pan pane.
You use the Zoom & Pan pane to change the zoom factor, and to pan over
images.
6
Scale pane.
You use the Scale pane to carry out various adjustments on the image. You
can choose between several different adjustment methods, and also assign
a color to display portions of the image that lie above or below a set tem-
perature level, or inside a set temperature interval.
7
Results pane.
The results pane displays the results of any measurement tools that you
have laid out in the image. This pane also displays the position of each
measurement tool, and controls in which way you want to plot temperatures
in a plot window.
8
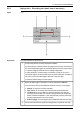
Plot window.
The plot window displays how the temperature changes over time in a
recorded sequence file. In this area you can set various options, such as
background and foreground color, etc.
9
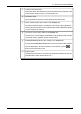
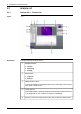
Live source control (also visible on the Organize tab).
The live source control displays a thumbnails of the image from the currently
connected camera, together with the camera name.
10
Connect/Disconnect button (also visible on the Analyze tab).
You use the Connect/Disconnect button to connect or disconnect cameras
from the application. To see all cameras on the network, click the
button in the bottom left corner.
11
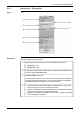
Log area.
The log area displays all events that occur during the time a camera is
connected. You can clear the log, and also export the log data as an HTML
or XML file.
12
Performance area.
The Performance area displays the performance of the currently connected
camera. Here you can review the frame rate, recording time, number of
stored and lost image frames, etc.
13
This area displays parameters, such as focus, calibration, measurement
range, image size, etc.
14
Publ. No. T559132 Rev. a449 – ENGLISH (EN) – April 21, 2010 29
9 – Overview of screen elements