
User Manual


Table Of Contents
- ExtendAir® (TDD) Series Digital Microwave Radios Installation and Management Guide
- Legal Notice
- Open-Source License Information
- Table of Contents
- Notes for Customers of the Cisco Configuration ExtendAir r5005
- About this Document
- Introduction
- Pre-installation Tasks
- Link Engineering and Site Planning
- Familiarization with the ExtendAir (TDD) Series Radios
- Initial Configuration and Back-to-Back Bench Test
- Time Division Duplex (TDD) Factors
- Link Orientation and Synchronization
- Radio Synchronization
- Offset Timing
- Virtual Local Area Network (VLAN)
- Simple Network Management Protocol (SNMP)
- System Installation and Initiation Process
- Installation
- Configuration and Management
- Telnet into the Command Line Interface (CLI)
- Telnet
- Exalt Graphical User Interface (GUI)
- Quick Start
- Navigating the GUI
- Radio Information Page
- Administration Settings Page
- NTP and Time Zones Configurations Page
- Simple Network Management Protocol (SNMP) Configuration
- File Management Pages
- File Transfer Page
- File Activation Page
- System Configuration Page
- Ethernet Interface Configuration Page
- T1/E1 Configuration Pages
- VLAN Configuration Page
- Ethernet Rate Limiting
- QoS Configuration Page
- Automatic Channel Selection (ACS) Page
- Syslog Configuration Page
- GPS Information Page
- Alarms Page
- Performance Page
- Event Log Page
- User Throughput Page
- Diagnostic Charts Page
- Spectrum Analyzer Page
- Ethernet Utilization Page
- Reboot Page
- Manual Page
- Specifications
- Interface Connections
- Antennas
- Troubleshooting
- Back-to-back Bench Testing
- General Compliance and Safety
- Dynamic Frequency Selection
- Safety Notices
- Regulatory Notices
- Regulatory Compliance
- EIRP Limits for the United States and Canada
- EIRP Limits for Australia
- EIRP Limits for the European Union and ITU Countries
- Declaration of Conformity to the R&TTE Directive 1999/5/EC
- Exalt Limited Hardware Warranty Software License and RMA Procedures Agreement
- Copyright Notices
- Index
Exalt Installation and Management Guide
ExtendAir (TDD) Series Digital Microwave Radios
82 203591-011
2013-02-22
Use the smallest step size to obtain the finest view of the spectrum. The spectrum analyzer can be set
to match the start and stop frequency for a dwell mode. Peak and average detection modes are also
available. Peak detection is helpful for capturing intermittent events such as pulsed emissions.
It is best to set the Scan Time option to a time value as opposed to using the ‘infinity’ setting. If your
management computer is connected to the radio through the radio link, access to the GUI is interrupted
during the duration of the analysis.
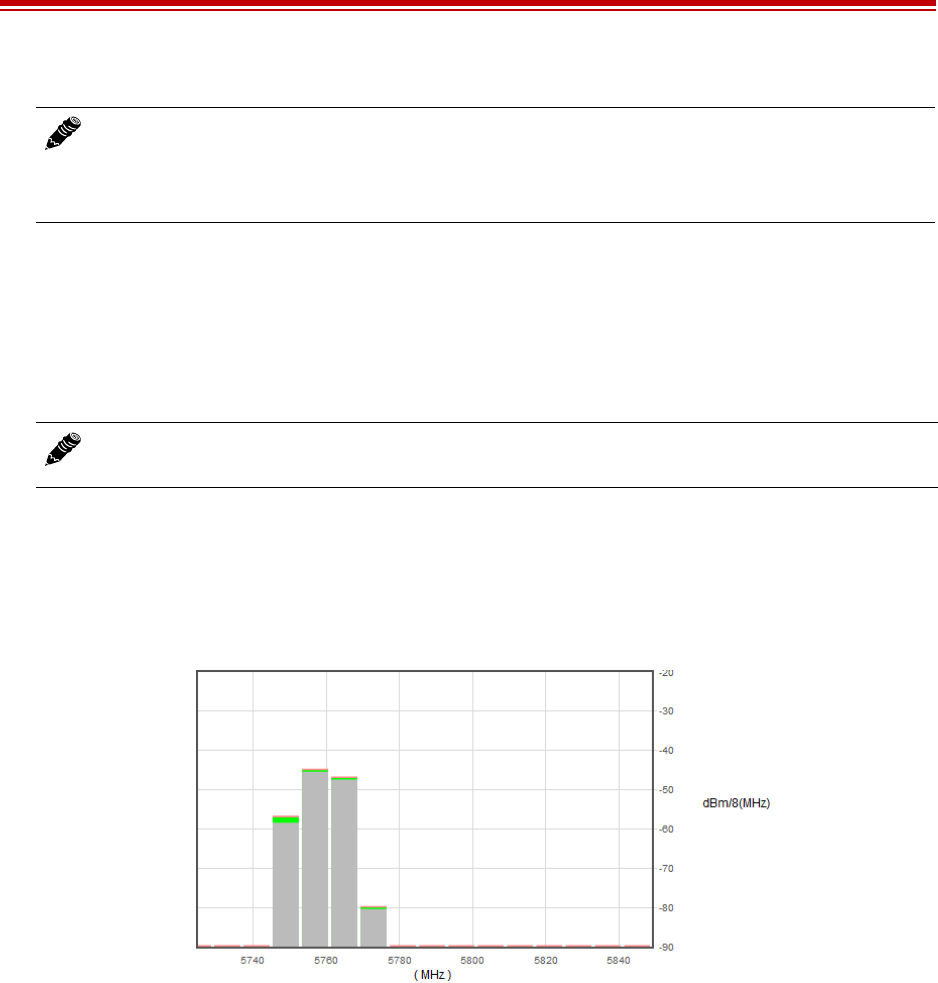
The spectrum analyzer graph displays received signals in red, green or grey (Figure 52), normalized in
dBm to the resolution bandwidth of the analyzer. Red indicates a peak hold function. This is the
highest level detected during the entire scan. Green indicates the last value measured at that frequency.
Grey indicates the lowest value detected during the entire scan. Mouse over an area to view the details
above the graph.
Figure 52 Spectrum analyzer graph example
A completely grey vertical box indicates that the signal maintained a steady level for the entire scan. A
mostly green box indicates that the last scan measured at a strong or stronger level than the rest of the
analysis. A completely red vertical box indicates that there was a signal at some point during the scan,
but that the signal was not detected at the last scan. A graph displaying green on the lower part and red
at the upper part indicates that at some time during the scan, a signal was detected at a higher level than
was detected during the last scan.
The last spectrum analyzer scan performed displays in this page until the radio is rebooted. You can do
a screen capture for record keeping and for comparison to future analyses. The time and date of the
analysis displays on the page, which is handy as a reference in a screen capture.
Note: Enabling the spectrum analyzer interrupts all radio traffic for the duration of the
analysis. In addition, access to the radio’s GUI may also be interrupted, depending on the
location of the interfaced computer relative to the radio where the spectrum analysis is
occurring. The GUI is available at the completion of the spectrum analysis.
Note: The result of selecting infinity may be complete loss of contact to that radio and may
require a physical visit to the radio location to disable the spectrum analyzer.