
Instruction manual

Instruction Manual PC 510
33
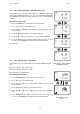
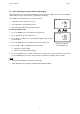
8.7 P6.0: Viewing conductivity probe data
Program 6 has five “view-only” options that let you check the probe’s parameters for diagnostic
purposes. These options show you the effective cell constant for each range. The cell constant adjusts
according to your calibration.
This function applies for conductivity & TDS mode.
From conductivity or TDS measurement mode
1. Press the MODE key to select conductivity or TDS measurement
mode.
2. Press the SETUP key to enter Setup mode.
3. Press the or key to scroll through sub-groups until you view
parameter P6.0.
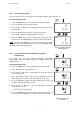
4. Press the ENTER key repeatedly to view the effective cell
constant for each range.
• P6.1 = Range 1 (0.00 – 19.99 µS or 0.00 – 9.99 ppm)
• P6.2 = Range 2 (0.0 – 199.9 µS or 0.0 – 99.9 ppm)
• P6.3 = Range 3 (0 – 1999 µS or 0 – 999 ppm)
• P6.4 = Range 4 (0.00 – 19.99 mS or 0.00 – 9.99 ppt)
• P6.5 = Range 5 (0.0 –199.9 mS or 0.0 – 99.9 ppt)
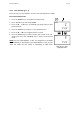
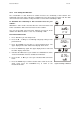
5. When you have scrolled through all probe data, you will
automatically return to the sub-group menu. Press the CAL/MEAS
key to return to measurement mode.
NOTE:
Cell constants will degrade with time and usage. You can use
this feature to alert you to the need for a new probe prior to total
failure.
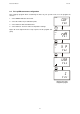
Figure 34: View probe data for
each measurement range
SETUP
p 6.0
ele
SETUP
1.000
p 6.1
k =
SETUP
p 6.2
1.000
k =
SETUP
p 6.3
.985
k =
mS
S
ppt
ppm
µ
E
N
T
E
R
R
A
N
G
E
E
N
T
E
R
R
A
N
G
E
E
N
T
E
R
R
A
N
G
E