
Manual


Using the Diagnostic Tool
CODE RETRIEVAL PROCEDURE
42 OBD2
9. If more than one code was retrieved press the DTC SCROLL button,
as necessary, to display additional codes one at a time.
Whenever the Scroll function is used to view additional codes,
the Diagnostic Tool’s communication link with the vehicle’s
computer disconnects. To re-establish communication, press the
LINK
button again.
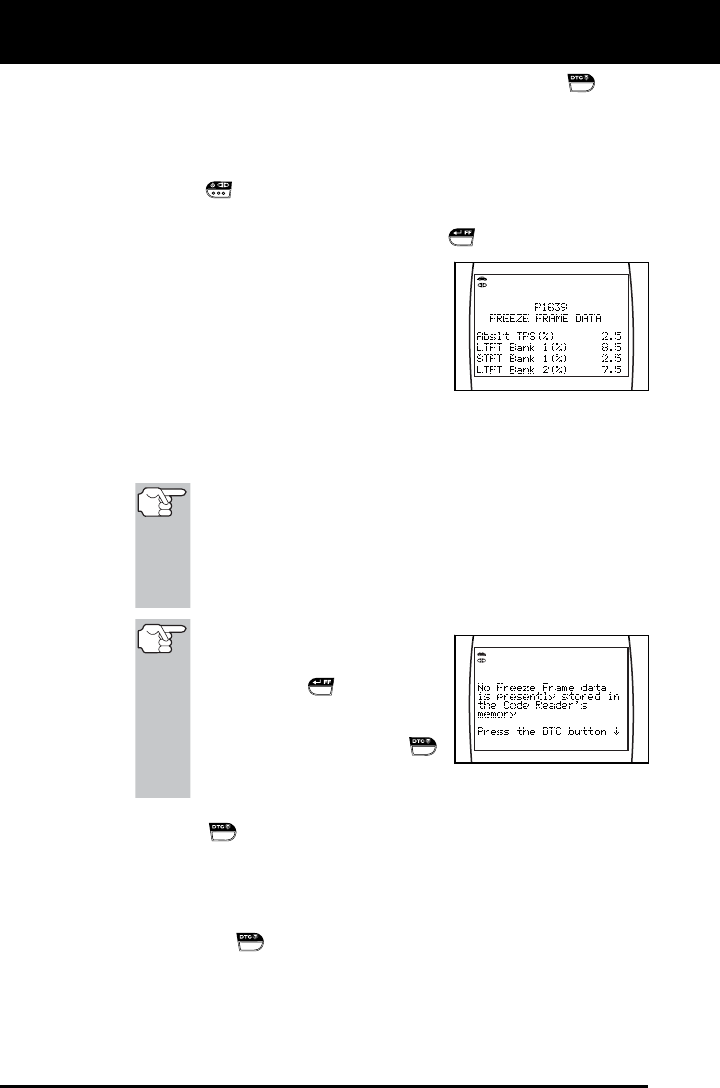
10. Freeze Frame Data (if available) can be viewed at any time (except
MENU mode) by pressing the ENTER/FF
button.
In OBD2 systems, when an
emissions-related engine malfunction
occurs that causes a DTC to set, a
record or snapshot of engine
conditions at the time that the
malfunction occurred is also saved in
the vehicle’s computer memory. The
record saved is called Freeze Frame
data. Saved engine conditions include, but are not limited to:
engine speed, open or closed loop operation, fuel system
commands, coolant temperature, calculated load value, fuel
pressure, vehicle speed, air flow rate, and intake manifold pressure.
If more than one malfunction is present that causes more
than one DTC to be set, only the code with the highest
priority will contain Freeze Frame data. The code
designated “01” on the Diagnostic Tool display is referred
to as the PRIORITY code, and Freeze Frame data always
refers to this code. The priority code is also the one that
has commanded the MIL on.
If Freeze Frame data is not
available for the code shown
on the LCD display when the
ENTER/FF
button is
pressed, an advisory message
shows on the LCD display.
Press the DTC SCROLL
button to return to the previous
code display.
11. When the last retrieved DTC has been displayed and the DTC
SCROLL
button is pressed, the Diagnostic Tool enters the
“enhanced” mode.
See VIEWING ENHANCED DTCs on page 45 to view enhanced
DTCs for your vehicle.
If you do not wish to view enhanced DTCs, press the DTC
SCROLL
button to return to the OBD2 DTC screen.
12. Determine engine system(s) condition by viewing the Diagnostic
Tool’s LCD display for any retrieved Diagnostic Trouble Codes,
code definitions, Freeze Frame data and interpreting the green,
yellow and red LEDs.