
Installation guide


QuadroM32x/8L/26x/12Li/26xi Manual II: Administrator's Guide Administrator’s Menus
QuadroM32x/8L/26x/12Li/26xi; (SW Version 5.3.x)
36
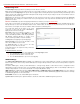
The Start E1/T1 Diagnostics button is used to initiate E1/T1 Link Diagnostic and Diagnostic Loopback. With these tests E1/T1 physical link is
checked, Frame Synchronization and Red Alarm states are verified. For successful Link Diagnostic, remote side should have Line_loopback or
Payload_loopback settings configured or a loopback terminator should be plugged to the Quadro's E1/T1 port. Diagnostic Loopback will be initiated
if Link Diagnostic is failed or E1/T1 link is down.
The Start Network Diagnostics button is used to initiate
network diagnostics, i.e., to check the WAN link and IP
configuration, to verify gateway, DNS primary and secondary
(if configured) servers' accessibilities.
The Reboot this Device button is used to reboot the
Quadro. Please note that the session with the Quadro will be
closed, i.e., the Quadro GUI should be newly opened and a
new login will be required afterwards.
The Start Call Capture button leads to the Call Capture
page where active calls and available interfaces may be
captured.
The Download system logs button is used to download all
logs to the local PC as a *.tar archive file. These logs can
then be used by the Epygi Technical Support Office to
determine the problem that has occurred on your Quadro.
Fig. II-62: System Diagnostic page
The field below will display the diagnostics results and the connectivity conditions. The system should be reconfigured if problems occur during the
diagnostics.
Attention: The Start E1/T1 Diagnostics button is available only for QuadroM32x. The QuadroM8L/26x has Start FXO Diagnostics button instead
of Start E1/T1 Diagnostics and the QuadroM12Li/26xi has Start ISDN Diagnostics button instead of Start E1/T1 Diagnostics.
The Start FXO Diagnostics button runs FXO diagnostic tests to determine the optimal value for the FXO country specific regional setting (CSRS)
appropriate to your PSTN provider. Once the FXO diagnostic is complete, the recommended value should be set manually on the fxocfg hidden cgi.
Setting this value may resolve echo or poor audio quality issues on FXO lines.
The Start ISDN Diagnostics button is used to initiate ISDN BRI low level diagnostic. With these tests the ISDN physical link is checked and the
Frame Synchronization is verified.
Show System Logs link leads to the page where Quadro’s logs might be viewed, downloaded and the logging setting may be adjusted.
System Logs
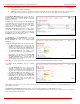
The System Logs page is accessible by pressing the Show System Logs link on the Diagnostics page. This page is used to adjust system logging
settings, view system logs directly in your browser or download them locally to your PC.
The System Logs page consists of three sub-pages.
The System Logs Settings page is used to adjust the system logging settings and contains the following components.
The Enable User Logging checkbox is used to enable user level logging. This logging contains brief information about events on the Quadro.
The Enable Developer Logging checkbox is used to enable developer high level logging. This logging contains detailed information about events
on the Quadro.
The Log Lines to Show drop down list is used to choose the maximum number of log lines to display on the View System Logs page.