
Installation guide


QuadroM32x/8L/26x/12Li/26xi Manual II: Administrator's Guide Administrator’s Menus
QuadroM32x/8L/26x/12Li/26xi; (SW Version 5.3.x)
15
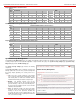
• Received Bytes
• Received Packets
• Received Errors
• Received Drop Errors
• Received Overrun Errors
• Received MultiCast
Packets
• Transmitted Bytes
• Transmitted Packets
• Transmitted Errors
• Transmitted Drop Errors
• Transmitted Carrier Errors
• Transmitted Collisions
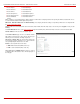
When opening the corresponding interface statistics window, no traffic values are displayed at first. After opening the window, the tables will serve as
a counter and traffic statistics will be updated every minute.
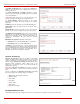
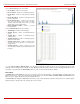
DNS Server, Alternative DNS Server and Default Gateway - these display the Quadro settings corresponding to what has been configured with
the
System Configuration Wizard.
Services (NTP Server and Client, DHCP Server and Client, DNS, Firewall, NAT, PPP, IDS) statuses: shows if they have stopped or if they are still
running.
The View VPN Status link refers to the
VPN Configuration page where all VPN (IPSec, PPTP and L2TP) connections can be viewed and edited.
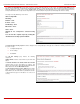
Transfer Statistics - link to the Transfer Statistics page.
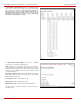
The Transfer Statistics page shows a user-defined statistics
table with the transmit/receive value (criteria), interface type
and time period. It contains the following components:
Time range of statistic table - the drop down list includes the
period (in days) statistics data that is to be collected and the
corresponding diagram charts that are to be built.
Interface - the drop-down list offer the values:
• WAN - Wide Area Network (WAN) events only
• LAN - Local Area Network (LAN) events only
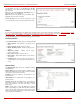
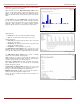
When Show also as readable values checkbox is selected,
an additional table with statistics values will be displayed on
the next page.
Fig. II-18: Transfer Statistics page