MF1121-03a CMOS 4-BIT SINGLE CHIP MICROCOMPUTER S5U1C62000A Manual (S1C60/62 Family Assembler Package)
NOTICE No part of this material may be reproduced or duplicated in any form or by any means without the written permission of Seiko Epson. Seiko Epson reserves the right to make changes to this material without notice.
Configuration of product number Devices S1 C 60N01 F 0A01 00 Packing specifications 00 : Besides tape & reel 0A : TCP BL 2 directions 0B : Tape & reel BACK 0C : TCP BR 2 directions 0D : TCP BT 2 directions 0E : TCP BD 2 directions 0F : Tape & reel FRONT 0G : TCP BT 4 directions 0H : TCP BD 4 directions 0J : TCP SL 2 directions 0K : TCP SR 2 directions 0L : Tape & reel LEFT 0M : TCP ST 2 directions 0N : TCP SD 2 directions 0P : TCP ST 4 directions 0Q : TCP SD 4 directions 0R : Tape & reel RIGHT 99 : Spe
INTRODUCTION Introduction This document describes the development procedure from assembling source files to debugging. It also explains how to use each development tool of the S1C62 Family Assembler Package common to all the models of the S1C62 Family. How To Read the Manual This manual was edited particularly for those who are engaged in program development.
INTRODUCTION Manual Notations This manual was prepared by following the notation rules detailed below: (1) Sample screens The sample screens provided in the manual are all examples of displays under Windows®95. These displays may vary according to the system or fonts used. (2) Names of each part The names or designations of the windows, menus and menu commands, buttons, dialog boxes, and keys are annotated in brackets [ ].
CONTENTS Contents CHAPTER 1 GENERAL ................................................................................................ 1 1.1 1.2 Features ......................................................................................................... 1 Tool Composition .......................................................................................... 2 1.2.1 Composition of Package .............................................................................. 2 1.2.
CONTENTS 4.7 Source Editor ............................................................................................... 31 4.7.1 Creating a New Source or Header File ...................................................... 31 4.7.2 Loading and Saving Files .......................................................................... 32 4.7.3 Edit Function ............................................................................................. 33 4.7.4 Tag Jump Function .................................
CONTENTS 5.7.10 Global Declaration Pseudo-Instruction (.global) .................................... 80 5.7.11 List Control Pseudo-Instructions (.list, .nolist) ........................................ 81 5.7.12 Source Debugging Information Pseudo-Instructions (.stabs, .stabn) ...... 81 5.7.13 Comment Adding Function ...................................................................... 82 5.7.14 Priority of Pseudo-Instructions ................................................................ 82 5.8 5.9 5.
CONTENTS CHAPTER 8 DISASSEMBLER ...................................................................................... 112 8.1 8.2 Functions ..................................................................................................... 112 Input/Output Files ....................................................................................... 112 8.2.1 Input Files ................................................................................................. 112 8.2.2 Output Files ............
CONTENTS 9.8 Debug Functions ......................................................................................... 141 9.8.1 Loading Program and Option Data .......................................................... 141 9.8.2 Source Display and Symbolic Debugging Function ................................. 142 9.8.3 Displaying and Modifying Program, Data, and Register ......................... 144 9.8.4 Executing Program ..................................................................................
CONTENTS 9.9.13 Trace ........................................................................................................ 200 tc (trace condition) ...................................................................... 200 ta (trace area) .............................................................................. 201 tac (trace area clear) ................................................................... 203 tp (trace pointer) .......................................................................
CHAPTER 1: GENERAL CHAPTER 1 GENERAL 1.1 Features The S1C62 Family Assembler Package contains software development tools that are common to all the models of the S1C62 Family. The package comes as an efficient working environment for development tasks, ranging from source program assembly to debugging. Its principal features are as follows: Simple composition A task from assembly to debugging can be made with minimal tools.
CHAPTER 1: GENERAL 1.2 Tool Composition 1.2.1 Composition of Package The S1C62 Family Assembler Package contains the items listed below. When it is unpacked, make sure that all items are supplied. 1) CD-ROM ................................................................................. One 2) Warranty card ......................................................................... One each in English and Japanese 1.2.
CHAPTER 2: INSTALLATION CHAPTER 2 INSTALLATION This chapter describes the required working environments for the tools supplied in the S1C62 Family Assembler Package and their installation methods. 2.1 Working Environment To use the S1C62 Family Assembler Package, the following conditions are necessary: Personal computer An IBM PC/AT or a compatible machine which is equipped with a CPU equal to or better than a Pentium 75 MHz, and 32MB or more of memory is recommended.
CHAPTER 2: INSTALLATION 2.2 Installation Method The supplied CD-ROM contains the installer (Setup.exe) that installs the tools. To install the tools (1) Start up Windows®95 or Windows NT®4.0. When Windows has already activated, terminate all the programs activated. (2) Insert the CD-ROM into the CD-ROM drive, and display its contents. (3) Start up the Setup.exe by double-clicking the icon. Welcome (4) Click [Next>] to continue installation.
CHAPTER 2: INSTALLATION InstallShield Wizard Complete (6) Click [Finish] to terminate the installer. Program Menu Installer registers the WorkBench62 icon to the program menu. To discontinue installation The dialog boxes that appear during installation have a [Cancel] button. To discontinue installation, click [Cancel] when a dialog box appears. To uninstall the tools Use [Add/Remove Programs] in the control panel to uninstall the tools.
CHAPTER 2: INSTALLATION 2.3 Directories and Files after Installation The installer copies the following files in the specified directory (default is "C:\EPSON\S1C62"): [Specified folder] README.TXT ... ReadMe document [bin] WB62.EXE AS62.EXE LK62.EXE HX62.EXE DS62.EXE DB62.EXE IEEE695.DLL HEXLIB.DLL AS62.DLL CORE62.DLL ICE62.DLL MSVCRT.DLL OLEPRO32.DLL SPAWNEX.EXE ... Work bench ... Assembler ... Linker ... Hex converter ... Disassembler ... Debugger ... Object format library for debugger ...
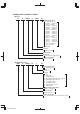
CHAPTER 3: SOFTWARE DEVELOPMENT PROCEDURE CHAPTER 3 SOFTWARE DEVELOPMENT PROCEDURE This chapter outlines a basic development procedure. 3.1 Software Development Flow Figure 3.1.1 represents a flow of software development work. Work Bench wb62 Make file file.MAK Development tools for each model file.S or file.DAT Assembly source file(s) file.par Function Option Generator fog62XX Assembler fileF.HEX as62 Assembly list file(s) Linker command file file.LST file.O Object file(s) file.
CHAPTER 3: SOFTWARE DEVELOPMENT PROCEDURE 3.2 Development Using Work Bench This section shows a basic development procedure using the work bench wb62. Refer to Chapter 4, "Work Bench", for operation details. 3.2.1 Starting Up the Work Bench Start up the work bench by choosing "WorkBench62" from the program menu.
CHAPTER 3: SOFTWARE DEVELOPMENT PROCEDURE 3.2.2 Creating a New Project The work bench manages necessary file and tool setting information as a project. First a new project file should be created. 1. Select [New] from the [File] menu (or click the [New] button). [New] button The [New] dialog box appears. 2. Select [E0C Project File] and click [OK]. The [Project] dialog box appears. 3. Enter a project name, select an ICE parameter file and select a directory, then click [OK].
CHAPTER 3: SOFTWARE DEVELOPMENT PROCEDURE A new edit window appears. [Edit] window 3. Enter source codes in the [Edit] window. 4. Save the source in a file by selecting [Save] from the [File] menu (or clicking the [Save] button).
CHAPTER 3: SOFTWARE DEVELOPMENT PROCEDURE 5. Click the [Insert into project] button on the [Edit] window. [Insert into project] button The created source file is added in the project. To add existing source files, use [Files into project...] in the [Insert] menu. It can also be done by dragging source files from Windows Explorer to the project window. Create necessary source files and add them into the project. Sample list in the [Project] window The added source files are listed in the project window.
CHAPTER 3: SOFTWARE DEVELOPMENT PROCEDURE 3.2.5 Building an Executable Object To make an executable object file: 1. Select [Build] from the [Build] menu (or click the [Build] button). [Build] button This will invoke the assembler and linker to create an executable object file. If a HEX file format (Intel HEX or Motorola S) is selected by the [Output format] box, the HEX converter will be invoked after linking. By default, an absolute object file in IEEE-695 format will be created.
CHAPTER 3: SOFTWARE DEVELOPMENT PROCEDURE 3.2.6 Debugging To debug the executable object: 1. Select [Debug] from the [Build] menu (or click the [Debug] button). [Debug] button The debugger starts up with the specified ICE parameter file and then loads the executable object file. Note: Make sure that the ICE is ready to debug before invoking the debugger. Refer to the ICE hardware manual for settings and startup method of the ICE. For the debugging functions and operations, refer to Chapter 9, "Debugger".
CHAPTER 4: WORK BENCH CHAPTER 4 WORK BENCH This chapter describes the functions and operating method of the Work Bench wb62. 4.1 Features The Work Bench wb62 provides an integrated operating environment ranging from editing source files to debugging. Its functions and features are summarized below: • Source edit function that supports copy/paste, find/replace, print, label jump and tag jump from error messages. • Allows simple management of all necessary files and information as a project.
CHAPTER 4: WORK BENCH 4.3 Work Bench Windows 4.3.1 Window Configuration Menu bar [Project] window Toolbar [Edit] window [Output] window Status bar The work bench has three types of windows: [Edit] window, [Project] window and [Output] window. [Edit] window This window is used for editing a source file. A standard text file can also be displayed in this window. Two or more windows can be opened in the edit window area.
CHAPTER 4: WORK BENCH [Output] window This window displays the messages delivered from the executed tools in a build or assemble process. Double-clicking a syntax error message with a source line number displayed in this window activates or opens the [Edit] window of the corresponding source so that the source line in which the error has occurred can be viewed. Menu bar Refer to Section 4.5. Toolbar Refer to Section 4.4.
CHAPTER 4: WORK BENCH Closing the [Project] and [Output] window The [Project] window and the [Output] window can be closed by selecting [Project Window] and [Output Window] from the [View] menu, respectively. To open them, select the menu items again. Maximizing the [Edit] window area The [Edit] window area can be maximized to the full screen size by selecting [Full Screen] from the [View] menu. All other windows and toolbars are hidden behind the [Edit] window area.
CHAPTER 4: WORK BENCH 2 Tile windows To tile windows vertically, select [Tile Vertically] from the [Window] menu or click the [Tile Vertically] button. [Tile Vertically] button To tile windows horizontally, select [Tile Horizontally] from the [Window] menu or click the [Tile Horizontally] button.
CHAPTER 4: WORK BENCH 3 Maximizing an [Edit] window Click the [Maximize] button on the window title bar. The window will be maximized to the [Edit] window area size and other [Edit] windows will be hidden behind the active window. 4 Minimizing an [Edit] window Click the [Minimize] button on the window title bar. The window will be minimized as a window icon. The minimized icons can be arranged at the bottom of the [Edit] window area by selecting [Arrange Icons] from the [Window] menu.
CHAPTER 4: WORK BENCH 4.4 Toolbar and Buttons Tree types of toolbars have been implemented in the work bench: standard toolbar, build toolbar and window tool bar. Standard toolbar Build toolbar Window toolbar 4.4.1 Standard Toolbar This toolbar has the following standard buttons: [New] button Creates a new document. A dialog box will appear allowing selection from among three document types: E0C62 assembly source, E0C62 assembly header and project. [Open] button Opens a document.
CHAPTER 4: WORK BENCH 4.4.2 Build Toolbar This tool bar has the following buttons and list boxes used to build a project: [Assemble] button Assembles the assembly source in the active [Edit] window. This button becomes active only when the active [Edit] window shows an assembly source file. [Build] button Builds the currently opened project using a general make process. [Rebuild All] button Builds the currently opened project.
CHAPTER 4: WORK BENCH 4.4.4 Toolbar Manipulation Hiding and showing toolbars Each toolbar can be hidden if not needed. Select the toolbar name from the [View] menu. This operation toggles between hiding and showing the toolbar. Changing the toolbar location Toolbars can be moved to another location in the toolbar area by dragging them. If a toolbar is moved out of the toolbar area, it will be changed to a window. 4.4.
CHAPTER 4: WORK BENCH 4.5 Menus 4.5.1 [File] Menu [New...] ([Ctrl]+[N]) Creates a new document. A dialog box will appear allowing selection from among three document types: E0C62 assembly source, E0C62 assembly header and project. [Open...] ([Ctrl]+[O]) Opens a document. A dialog box will appear allowing selection of the file to be opened. [Close] Closes the active [Edit] window. This menu item appears when an [Edit] window becomes active. [Open Workspace...] Opens a project.
CHAPTER 4: WORK BENCH 4.5.2 [Edit] Menu [Undo] ([Ctrl]+[Z]) Undoes the previous executed operation in the [Edit] window. [Cut] ([Ctrl]+[X]) Cuts the selected text in the [Edit] window to the clipboard. [Copy] ([Ctrl]+[C]) Copies the selected text in the [Edit] window to the clipboard. [Paste] ([Ctrl]+[V]) Pastes the text copied on the clipboard to the current cursor position in the [Edit] window or replaces the selected text with the copied text.
CHAPTER 4: WORK BENCH 4.5.4 [Insert] Menu [File...] Inserts the specified file to the current cursor position in the [Edit] window or replaces the selected text with the contents of the specified file. A dialog box will appear allowing selection of the file to be inserted. [Files into project...] Adds the specified source file in the currently opened project. A dialog box will appear allowing selection of the file to be added. 4.5.
CHAPTER 4: WORK BENCH 4.5.7 [Window] Menu This menu appears when an [Edit] window is opened. [Cascade] Cascades the opened [Edit] windows. [Tile Horizontally] Tiles the opened [Edit] window horizontally. [Tile Vertically] Tiles the opened [Edit] window vertically. The currently opened document file names are listed in this menu. Selecting one activates the [Edit] window. [Arrange Icons] Arranges the minimized [Edit] window icons at the bottom of the [Edit] window area.
CHAPTER 4: WORK BENCH 4.6 Project and Work Space The work bench manages a program development task using a work space folder and a project file that contains file and other information necessary for invoking the development tools. 4.6.1 Creating a New Project A new project file can be created by the following procedure: 1. Select [New] from the [File] menu or click the [New] button. [New] button The [New] dialog box appears. 2. Select [E0C Project File] and click [OK]. The [Project] dialog box appears.
CHAPTER 4: WORK BENCH 4.6.2 Inserting Sources into a Project The sources created must be inserted into the project. To insert a source into a project, use one of the four methods shown below: 1. [Insert | Files into project...] menu item A dialog box appears when this menu item is selected. Choose a source file from the list box and then click [Open]. 2. [File | Open...] menu item or [Open] button [Open] button A dialog box appears when this menu item or button is selected.
CHAPTER 4: WORK BENCH 4.6.3 [Project] Window The [Project] window shows the work space folder and the source files included in the project that has been opened. When a source file icon is double-clicked, the source file will be opened or the corresponding [Edit] window will be activated. When the folder icon or a source file icon is double-clicked with the right mouse button, a shortcut menu including the available build menu items appears.
CHAPTER 4: WORK BENCH 4.6.5 Files in the Work Space Folder The work bench generates the following files in the work space folder: .epj Project file This file contains the project information. .cm Linker command file This file is generated when a build task is started, and is used by the linker to generate an absolute object file. Example: ; WorkBench62 Generated ; Friday, May 01, 1998 "C:\E0C62\dev62\Dev621c\Ics621cp.par" -o "test.
CHAPTER 4: WORK BENCH 4.7 Source Editor The work bench has a source editor function. Sources can be created and modified in the [Edit] window. 4.7.1 Creating a New Source or Header File To create a new source file: 1. Select [New] from the [File] menu or click the [New] button. [New] button The [New] dialog box appears. 2. Select [E0C Assembly Source File] and click [OK]. An [Edit] window appears. [Edit] window Enter source codes here. Enter source codes in this window.
CHAPTER 4: WORK BENCH 4.7.2 Loading and Saving Files To load a source file: 1. Select [Open...] from the [File] menu or click the [Open] button. [Open] button The [Open] dialog box appears. 2. Choose a source file to be opened after selecting the file type (*.s, *.ms, *.dat) and click [OK]. An [Edit] window opens and shows the contents of the source file.
CHAPTER 4: WORK BENCH To save the source: 1. Activate the [Edit] window of the source to be saved. 2. Select [Save as...] from the [File] menu. The [Save As] dialog box appears. 3. Enter the file name and then click [OK]. When overwriting the source on the existing file, select [Save] from the [File] menu or click the [Save] button. [Save] button To save all the source files opened and the project file, use the [File | Save All] menu item or the [Save All] button. [Save All] button 4.7.
CHAPTER 4: WORK BENCH The controls in the dialog are as follows: [Find what:] text box Enter the word to be found in this text box. The specified word is maintained as the finding word even if this dialog box is closed. [Match whole word only] check box If this option is selected, the work bench searches only the words that are completely matched with the specified word. If not, only the part of word that matches the specified word will be searched.
CHAPTER 4: WORK BENCH [Find Next] button Clicking this button starts searching the specified word. If the specified word is found, the [Edit] window refreshes the display and highlights the word found. [Replace] button By clicking this button after the specified word is found, it is replaced with the substitute word. Then the work bench searches the next. [Replace All] button Replaces all the specified found words with the substitute word.
CHAPTER 4: WORK BENCH Shortcut menu The [Edit] window supports a short cut menu that appears by clicking the right mouse button on the [Edit] window. It can also be done by pressing the [Short cut menu] key while the [Edit] window is active if the key is available on the keyboard. It contains the editing menu items descried above, so you can select an edit command using this menu. 4.7.
CHAPTER 4: WORK BENCH 4.7.5 Printing The document in the [Edit] window can be printed out. The [Print...], [Print Preview] and [Page Setup...] commands are provided in the [File] menu. The [Print] button can also be used. They have the same function as those of standard Windows application. Select one after activating the [Edit] window of the document to be printed. 4.
CHAPTER 4: WORK BENCH To invoke only the assembler, select [Assemble] from the [Build] menu or click the [Assemble] button after activating the [Edit] window of the source to be assembled. [Assemble] button 4.8.3 Debugging To debug the generated executable file, select [Debug] from the [Build] menu or click the [Debug] button. [Debug] button The debugger starts up with the specified ICE parameter file and then loads the executable object by the command file generated from the work bench.
CHAPTER 4: WORK BENCH 4.8.4 Executing Other Tools The HEX converter and disassembler can be invoked independently. HEX converter To invoke the HEX converter, select [HEX converter...] from the [Tools] menu or click the [HEX convert] button. [HEX convert] button Then select an absolute object file to be converted in the [Hex data convert] dialog box. This dialog box allows selection of the HEX converter options. [ICE Parameter file:] list box Select an ICE parameter file from the pull-down list.
CHAPTER 4: WORK BENCH Disassembler To invoke the disassembler, select [Disassembler...] from the [Tools] menu or click the [Disassemble] button. [Disassemble] button Then select the executable object file to be disassembled in the [Disassemble] dialog box. This dialog box allows selection of the disassembler options. [ICE Parameter file:] list box Select an ICE parameter file from the pull-down list. [Output error log file] check box Select this option to generate the error log file of the disassembler.
CHAPTER 4: WORK BENCH 4.9 Tool Option Settings The development tools have startup options that can be specified when invoking them. These settings can be made in the [Settings] dialog box that appears by selecting [Settings...] from the [Build] menu. Click the tool name tab to view option settings of each tool. Clicking the [OK] button updates option setting information in the project and then closes the dialog box. To continue to select other tool options, click the [Apply] button.
CHAPTER 4: WORK BENCH The edit box shows the default setting ([Default]) and the list of source files in the project. The default setting applies to all the sources excluding ones that are specified independently. To select options of a specific source, select the check box at the front of the source file name. Check here → ■ sub.s No No No Each of the [Error file], [Debug info] and [List file] options is set to either "No" or "Yes" and it toggles by double-clicking.
CHAPTER 4: WORK BENCH The edit box shows the default setting ([Default]) and the list of source files in the project. The default setting applies to all the sections excluding those of the source specified. To set a specific source independently, select the check box at the front of the source file name. Check here → ■ sub.s 0x200 Other option selections [Disable all branch optimizations] check box Select this option if PSET insertions, deletions and corrections are not necessary.
CHAPTER 4: WORK BENCH 4.9.3 Debugger Options [COM Port:] list box Select a COM port of the personal computer used to communicate with the ICE. COM1 is set by default. [bps:] list box Select a baud rate to communicate with the ICE. 9600 bps is set by default. [Initial Command:] edit box This box is used to edit the debugger commands to be executed when the debugger starts up. The work bench generates a command file with the commands entered in this box and specifies it when invoking the debugger.
CHAPTER 4: WORK BENCH 4.
CHAPTER 4: WORK BENCH 4.12 Precautions (1) The source file that can be displayed and edited in the work bench is limited to 16M byte size. (2) The label search and coloring function of the work bench does not support labels that have not ended with a colon. (3) The work bench can create a make, linker command and debugger command files, note, however, that these files or settings created with another editor cannot be input into the work bench.
CHAPTER 5: ASSEMBLER CHAPTER 5 ASSEMBLER This chapter will describe the functions of the Assembler as62 and grammar involved with the creation of assembly source files. 5.1 Functions The Assembler as62 is a tool that constitutes the core of this software package. It assembles (translates) assembly source files and creates object files in the machine language. The functions and features of the assembler are summarized below: • Allows absolute and relocatable sections mixed in one source.
CHAPTER 5: ASSEMBLER 5.2.2 Output Files Object file File format: Binary file in relocatable IEEE-695 format File name: .o (The is the same as that of the input file, unless otherwise specified with -o option.) Output destination: Current directory Description: File in which machine language codes are stored in a relocatable form available for the linker to link with other modules and to generate an executable absolute object.
CHAPTER 5: ASSEMBLER 5.3 Starting Method General form of command line as62 ^ [options] ^ [] ^ denotes a space. [ ] indicates the possibility to omit. Source file name In the command line, only one assembly source file can be specified at a time. Therefore, you will have to process multiple files by executing the assembler the number of times equal to the number of files to be processed. A long file name supported in Windows and a path name can be specified.
CHAPTER 5: ASSEMBLER 5.4 Messages The assembler delivers all its messages through the Standard Output (stdout). Start-up message The assembler outputs only the following message when it starts up. Assembler 62 Ver x.xx Copyright (C) SEIKO EPSON CORP. 199x End message The assembler outputs the following messages to indicate which files have been created when it ends normally. Created preprocessed source file Created relocatable object file
CHAPTER 5: ASSEMBLER 5.5 Grammar of Assembly Source Assembly source files should be created on a general-purpose editor or the source editor of the work bench. Save sources as standard text files. For the file name, a long file name supported in Windows can be specified. Define the extension as ".s" when creating sources in the new syntax (for as62). When using source files described in the old syntax (for asm62XX), the default extension ".dat" should be used. Actually a ".s" source file and a ".
CHAPTER 5: ASSEMBLER Restrictions • Only one statement can be described in one line. A description containing more than two instructions in one line will result in an error. However, a comment or a label may be described in the same line with an instruction. Example: ;OK BOOT: ld a,0x4 ;Error BOOT: ld a,0x4 ld b,0x0 • One statement cannot be described in more than one line. A statement that cannot complete in one line will result in an error. Example: .codeword 0x0,0x1,0x2,0x3 ... OK .
CHAPTER 5: ASSEMBLER 5.5.2 Instructions (Mnemonics and Pseudo-instructions) The assembler supports all the mnemonics of the S1C6200 instruction set and the assembler pseudoinstructions. The following shows how to describe the instructions. Mnemonics An instruction is generally composed of [mnemonic] + [operand]. Some instructions do not contain an operand.
CHAPTER 5: ASSEMBLER Types of pseudo-instructions The following 23 types of pseudo-instructions are available: #include #define #macro #endm #ifdef #ifndef #else #endif .align .org .page .bank .code .bss .codeword .comm .lcomm .global .set .list .nolist .stabs .stabn The assembler supports the old-format pseudo-instructions for asm62XX as well as the above instructions. For details of each pseudo-instruction and its functionality, refer to Section 5.7, "Assembler PseudoInstructions".
CHAPTER 5: ASSEMBLER Scope The scope is a reference range of a label. It is called local if the label is to be referenced within the same file, and it is called global if the label is to be referenced from other files. Any defined label's scope is local in default. To make a label's scope global, use the .global pseudoinstruction both in the file in which the label is defined and in the file that references the label.
CHAPTER 5: ASSEMBLER 5.5.4 Comments Comments are used to describe a series of routines, or the meaning of each statement. Comments cannot comprise part of coding. Definition of comment A character string beginning with a semicolon (;) and ending with a line feed code (LF) is interpreted as a comment. Not only ASCII characters, but also other non-ASCII characters can be used to describe a comment. Examples: ;This line is a comment line. LABEL: ;This is the comment for LABEL.
CHAPTER 5: ASSEMBLER 5.5.7 Numerical Notations This Assembler supports three kinds of numerical notations: decimal, hexadecimal, and binary. Decimal notations of values Notations represented with 0–9 only will be regarded as decimal numbers. To specify a negative value, put a minus sign (-) before the value. Examples: 1 255 -3 Characters other than 0–9 and the sign (-) cannot be used. Hexadecimal notations of values To specify a hexadecimal number, place "0x" before the value.
CHAPTER 5: ASSEMBLER 5.5.8 Symbols The .set and #define pseudo-instr uctions allow definition of values as symbols. Examples: .set ADDR1 0x0f0 ... ADDR1 is a symbol that represents absolute address 0x0f0. #define CONST 0xf ... CONST is a symbol that represents data 0x0f. : ld a,CONST ... Will be expanded into "ld a, 0xf". The defined symbols can be used for specifying the immediate data of instructions.
CHAPTER 5: ASSEMBLER Relational operators == Equal != Not equal < Less than <= Less than or equal > Greater than >= Greater than or equal && AND || OR Examples SW==0 SW!=0 ABC<5 ABC<=5 ABC>5 ABC>=5 ABC&&0xf ABC||0b1010 Old operators EQ NE LT LE GT GE not available not available The relational operator returns 1 if the expression is true, otherwise it returns 0. Priority The operators have the priority shown below.
CHAPTER 5: ASSEMBLER Precautions • Minus numbers -1 to -32768 are handled as 0xffff to 0x8000. • The assembler handles expressions as 16-bit data. Pay attention to the data size when using it as 4-bit immediate data, especially when it has a minus value. Example: ld a,-2+1 ... NG. It will be expanded as "ld a,0xffff". ld a,(-2+1)&0xf ... OK. It will be expanded as "ld a,0xf". • Expressions are calculated with a sign (like a signed short in C language).
CHAPTER 5: ASSEMBLER 5.6 Section Management 5.6.1 Definition of Sections The memory configuration of the S1C62 Family is divided into a ROM that contains programs written, and data memories such as data RAM and I/O memory. A section refers to an area where codes are written (or to be mapped), and there are two types of sections in correspondence with the memories: 1. CODE section 2. BSS section Area located within program ROM. Area for dynamic data storage (built-in RAM, display memory and I/O memory).
CHAPTER 5: ASSEMBLER 5.6.3 Sample Definition of Sections : CODE1 (Relocatable program) : .bss : BSS1 (Relocatable RAM area definition) : .code : CODE2 (Relocatable program) : .bss .org 0x100 ... If this specification is omitted, a BSS section begins from the address following BSS1. : BSS2 (Absolute RAM area definition) : .code : CODE3 (Relocatable program) : .code .
CHAPTER 5: ASSEMBLER 5.7 Assembler Pseudo-Instructions The assembler pseudo-instructions are not converted to execution codes, but they are designed to control the assembler or to set data. For discrimination from other instructions, all the assembler pseudo-instructions begin with a character "#" or ".". The instructions that begin with "#" are preprocessed pseudo-instructions and they are expanded into forms that can be assembled. The expanded results are delivered in the preprocessed file (.ms).
CHAPTER 5: ASSEMBLER 5.7.1 Include Instruction (#include) The include instruction inserts the contents of a file in any location of a source file. It is useful when the same source is shared in common among several source files. Instruction format #include "" • A drive name or path name can as well be specified as the file name. • One or more spaces are necessary between the instruction and the "". • Character case is ignored for both #include itself and "".
CHAPTER 5: ASSEMBLER 5.7.2 Define Instruction (#define) Any substitute character string can be left defined as a Define name by the define instruction (#define), and the details of that definition can be referred to from various parts of the program using the Define name. Instruction format #define [] : • The first character is limited to a–z, A–Z, ? and _. • The second and the subsequent characters can use a–z, A–Z, 0–9, ? and _.
CHAPTER 5: ASSEMBLER Precautions • The assembler only permits backward reference of a Define name. Therefore the name definition must precede the use of it. • Once a Define name is defined, it cannot be canceled. However, redefinition can be made using another Define name. Example: #define MemX1 mx #define MemX2 MemX1 ldpx MemX2,my ... Expanded to "ldpx mx, my". • When the same Define name is defined duplicatedly, an error will result.
CHAPTER 5: ASSEMBLER 5.7.3 Macro Instructions (#macro ... #endm) Any statement string can be left defined as a macro using the macro instruction (#macro), and the content of that definition can be invoked from different parts of the program with the macro name. Unlike a subroutine, the part that is invoking a macro is replaced with the content of the definition. Instruction format #macro [] [,] ...
CHAPTER 5: ASSEMBLER Expansion rules When a defined macro name appears in the source, the assembler inserts a statement string defined in that location. If there are actual parameters described in that process, the dummy parameters will be replaced with the actual parameters in the same order as the latter are arranged. The internal branch labels are replaced, respectively, with __L0001 ... from top of the source in the same order as they appear.
CHAPTER 5: ASSEMBLER 5.7.4 Conditional Assembly Instructions (#ifdef ... #else ... #endif, #ifndef... #else ... #endif) A conditional assembly instruction determines whether assembling should be performed within the specified range, dependent on whether the specified name (Define name) is defined or not. Instruction formats Format 1) #ifdef [#else ] #endif If the name is defined, will be subjected to the assembling.
CHAPTER 5: ASSEMBLER Expansion rule A statement string subjected to the assembling is expanded according to the expansion rule of the other preprocessing pseudo-instructions. (If no preprocessing pseudo-instruction is contained, the statement will be output in a file as is.) Precaution A name specified in the condition is evaluated with discrimination between uppercase and lowercase. The condition is deemed to be satisfied only when there is the same Define name defined.
CHAPTER 5: ASSEMBLER 5.7.5 Section Defining Pseudo-Instructions (.code, .bss) The section defining pseudo-instructions define one related group of codes or data and make it possible to reallocate by the groups at the later linking stage. Even if these section defining pseudo-instructions are not used, the section kind will be automatically judged by its contents and causes no error.
CHAPTER 5: ASSEMBLER 5.7.6 Location Defining Pseudo-Instructions (.org, .bank, .page, .align) The absolute addressing pseudo-instructions (.bank, .page, .align and .org) work to specify absolute location of a section in different precision such as bank number level, page number level, 2n words alignment level and complete absolute address level. The .bank and .page pseudo-instructions are applicable to CODE section only, others are applicable to any kinds of sections (CODE and BSS sections). .
CHAPTER 5: ASSEMBLER • If the .org pseudo-instruction is defined immediately after a section definer (.code or .bss), the section definer does not start a new section. But .org starts a new section with the attribute of the section definer. Example: .code ... This does not start a new CODE section. .org 0x100 ... This starts an absolute CODE section. : • If the .org pseudo-instruction is defined immediately before a section definer (.code or .
CHAPTER 5: ASSEMBLER .page pseudo-instruction Instruction format .page : Absolute page number specification • Only decimal, binary and hexadecimal numbers can be described. • The page numbers that can be specified are from 0 to 15 (0xf). • One or more spaces or tabs are necessary between the instruction and the page number. Sample description: .code .page 0x1 Function Specifies an absolute page address of a CODE section in an assembly source file. The section with the .
CHAPTER 5: ASSEMBLER .bank pseudo-instruction Instruction format .bank : Absolute bank number specification • Only decimal, binary and hexadecimal numbers can be described. • The bank number that can be specified is 0 or 1. • One or more spaces or tabs are necessary between the instruction and the bank number. Sample description: .code .bank 1 Function Specifies an absolute bank address of a CODE section in an assembly source file. The section with the .
CHAPTER 5: ASSEMBLER .align pseudo-instruction Instruction format .align : Word alignment in 2n value • Only decimal, binary and hexadecimal numbers can be described. • The alignment that can be specified is a 2n value. • One or more spaces or tabs are necessary between the instruction and the alignment number. Sample description: .code .align 32 ... Sets the location to the next 32-word boundary address.
CHAPTER 5: ASSEMBLER 5.7.7 Symbol Defining Pseudo-Instruction (.set) Instruction format .set [,] : Symbols for value reference • The 1st character is limited to a–z, A–Z, ? and _. • The 2nd and the subsequent character can use a–z, A–Z, 0–9, ? and _. • Uppercase and lowercase are discriminated. • One or more spaces, or tabs are necessary between the instruction and the symbol. : Value specification • Only decimal, binary, and hexadecimal numbers can be described.
CHAPTER 5: ASSEMBLER 5.7.8 Data Defining Pseudo-Instruction (.codeword) .codeword pseudo-instruction Instruction format .codeword [, ...,] : 12-bit data • Only decimal, binary and hexadecimal numbers can be described. • The data that can be specified are from 0 to 4096 (0xfff). • One or more spaces or tabs are necessary between the instruction and the first data. • A comma (,) is necessary between one data and another. Sample description: .code .
CHAPTER 5: ASSEMBLER 5.7.9 Area Securing Pseudo-Instructions (.comm, .lcomm) Instruction format .comm .lcomm [,] [,] : Symbols for data memory access (address reference) • The 1st character is limited to a–z, A–Z, ? and _. • The 2nd and the subsequent character can use a–z, A–Z, 0–9, ? and _. • Uppercase and lowercase are discriminated. • One or more spaces or tabs are necessary between instruction and symbol.
CHAPTER 5: ASSEMBLER 5.7.10 Global Declaration Pseudo-Instruction (.global) Instruction format .global : Symbol to be defined in the current file, or symbol already defined in other module • One or more spaces or tabs are necessary between the instruction and the symbol. Sample description: .global GENERAL_SUB1 Function Makes global declaration of a symbol.
CHAPTER 5: ASSEMBLER 5.7.11 List Control Pseudo-Instructions (.list, .nolist) Instruction format .list .nolist Function Controls output to the relocatable list file. The .nolist pseudo-instruction stops output to the relocatable list file after it is issued. The .list pseudo-instruction resumes from there the output which was stopped by the .nolist pseudoinstruction. Precaution The assembler delivers relocatable list files only when it is started up with the -l option specified.
CHAPTER 5: ASSEMBLER 5.7.13 Comment Adding Function The preprocessing pseudo-instructions that begin with "#" are all expanded to codes that can be assembled, and delivered in the preprocessed file. Even after that, those instructions are rewritten with comments beginning with a semicolon (;), so that the original instructions can be identified. However, note that the replacements of Define names will not subsist as comments. The comment is added to the first line following the expansion.
CHAPTER 5: ASSEMBLER 5.8 Summary of Compatibility with the Older Tool The assembler provides the new features added to the old assembler asm62XX. However the compatibility with the old syntax is preserved by supporting old syntax as the synonym of the new syntax. As the result, as62 can process the old syntax sources without any modification. To realize it, the assembler accepts old syntax elements and interprets them to their equivalent counterparts in new syntax elements.
CHAPTER 5: ASSEMBLER 5.9 Relocatable List File The relocatable list file is an assembly source file that carries assembled results (offset addresses and object codes) added to the first half of each line. It is delivered only when the start-up option (-l) is specified. Its file format is a text file, and the file name, .lst. (The is the same as that of the input source file.) The format of each line of the assembly list file is as follows: Line No.
CHAPTER 5: ASSEMBLER 5.10 Sample Executions Command line C:\E0C62\bin\as62 -g -e -l main.s Assembly source file ; main.s ; test program (main routine) ; ;***** INITIAL SP ADDRESS DEFINITION ***** #define SP_INIT_ADDR 0x80 ;SP init addr = 0x80 ;***** BOOT, LOOP ***** .global INIT_RAM_BLK1 .global INC_RAM_BLK1 ; subroutine ; subroutine .
CHAPTER 5: ASSEMBLER Assembly list file Assembler 62 ver x.xx Relocatable List File MAIN.LST Wed Apr 22 15:31:00 1998 1: 2: 3: 4: 5: 6: 7: 8: 9: 10: 11: 12: 13: 14: 15: 16: 17: 18: 19: 20: 21: 22: 23: 24: 25: 26: ; main.s ; test program (main routine) ; ;***** INITIAL SP ADDRESS DEFINITION ***** #define SP_INIT_ADDR 0x80 ;SP init addr = 0x80 ;***** BOOT, LOOP ***** .global INIT_RAM_BLK1 .global INC_RAM_BLK1 ; subroutine ; subroutine .
CHAPTER 5: ASSEMBLER 5.11 Error/Warning Messages 5.11.1 Errors When an error occurs, no object file will be generated. The assembler error messages are delivered/displayed in the following format: () Error : Example: TEST.S(431) Error: Illegal syntax ∗ Some error messages are displayed without a line number. The assembler error messages are given below: Error message Cannot open file Description The specified file cannot be opened.
CHAPTER 5: ASSEMBLER 5.11.2 Warning When a warning occurs, the assembler will keep on processing, and terminates the processing after displaying a warning message, unless any other error is produced. The warning message is delivered/displayed in the following formats: () Warning : Example: TEST.
CHAPTER 6: LINKER CHAPTER 6 LINKER This chapter will describe the functions of the Linker lk62. 6.1 Functions The Linker lk62 is a software that generates executable object files. It provides the following functions: • • • • Puts together multiple object modules to create one executable object file. Resolves external reference from one module to another. Relocates relative addresses to absolute addresses.
CHAPTER 6: LINKER 6.2.2 Output Files An output file name can be specified in the command line or command file using the -o option. If no output file name is specified, the same name as that of the relocatable object file to be linked first is used. Absolute object file File format: Binary file in IEEE-695 format File name: .abs Output destination: Current directory Description: Object file in executable format that can be input to the debugger.
CHAPTER 6: LINKER 6.3 Starting Method General form of command line lk62 ^ [Options] ^ [] ^ [] ^ ^ denotes a space. [ ] indicates the possibility to omit. The order of options and file names can be arbitrary. File names Files are identified with their extensions. Therefore, an appropriate extension should be included in each file name. However, the extension ".o" of the relocatable object file can be omitted.
CHAPTER 6: LINKER -e Function: Output of error file Explanation: Also delivers in a file (.err) the contents to be output by the linker through the Standard Output (stdout), such as error messages. Default: If this option is not specified, no error file will be output. -g Function: Addition of debugging information Explanation: • Creates an absolute object file containing debugging information.
CHAPTER 6: LINKER -bss
Function: Set up of a relocatable BSS section start address Explanation: • Sets the absolute start address of a relocatable BSS section. Absolute sections remain unaffected. • BSS sections are mapped from this address, unless otherwise specified. • One or more spaces or tabs are necessary between -bss and . • The address should be described in hexadecimal format (0x####).CHAPTER 6: LINKER 6.4 Messages The linker delivers all its messages to the Standard Output (stdout). Start-up message The linker outputs only the following message when it starts up. Linker 62 Ver x.xx Copyright (C) SEIKO EPSON CORP. 199x End message The linker outputs the following messages to indicate which files has been created when it ends normally. Created Created Created Created Created Created absolute object file absolute list file map file
CHAPTER 6: LINKER 6.5 Linker Command File To simplify the keystroke in the command line at the time of start up, execute the link processing through the linker by inputting a linker command file (.cm) that holds the necessary specifications (options and file names) described. Sample linker command file -e ; -g ; -code 0x0100 ; -rcode test2.o = 0x0110 ; -bss 0x00e0 ; -o test.abs test1.o test2.
CHAPTER 6: LINKER 6.6 Link Map File The link map file serves to refer to the mapping information for the modules of each section. It is output if the -m option is specified. The file format is a text file, and its file name is ".map". ( is the same as that of the output object file.) Sample link map file Linker 62 ver x.xx Link map file "TEST.
CHAPTER 6: LINKER 6.7 Symbol File The symbol file serves to refer to the labels defined in all the modules and their address information. It is delivered if the -s start-up option is specified. The file format is a text file, and its file name is ".sym". ( is the same as that of the output object file.) Sample symbol file Linker 62 ver x.xx Symbol file "TEST.SYM" Sun May 03 14:16:16 1998 CODE section labels of "TEST.ABS" Address Type File Symbol 0x0100 Local "MAIN.O" ....
CHAPTER 6: LINKER 6.8 Absolute List File The absolute list file is an assembly source file that carries the absolute addresses and object codes added to the first half of each line. It is delivered only when the -l option is specified. Its file format is a text file, and the file name is .als. (The is the same as that of the output object file.
CHAPTER 6: LINKER 6.9 Cross Reference File The cross reference file enumerates all the address labels with their absolute addresses and all the addresses where the address labels are referred to. It is delivered only when the -x option is specified. Its file format is a text file, and the file name is .xrf. (The is the same as that of the output object file.) Sample cross reference file Linker 62 ver x.xx Cross reference file "TEST.
CHAPTER 6: LINKER 6.10 Linking Linking rules The linking process takes place in conformity with the following rules: • Absolute sections are mapped ahead of relocatable sections, according to the absolute addresses which were defined at the time of assembling. If an absolute section exceeds the available memory area, an error will occur. • The relocatable sections in the file of which the section start address was specified with an option (-rcode, -rbss) are mapped from the specified address.
CHAPTER 6: LINKER test1.o CODE1 BSS1 CODE2 BSS2 test.abs (relocatable) (relocatable) (absolute 0x000–) (absolute 0xe00–) 0x0000 CODE2 0x0110 CODE3 CODE4 test2.o CODE3 BSS3 CODE4 BSS4 0x010f CODE1 (relocatable) (absolute 0xf00–) (relocatable) (relocatable) ROM area 0x1fff 0x000 0x500 0x4ff BSS1 0x5ff 0x600 BSS4 RAM area 0xdff 0xe00 BSS2 0xf00 BSS3 0xeff 0xfff Fig. 6.10.
CHAPTER 6: LINKER 6.11 Automatic Insertion/Removal/Correction of "pset" Instruction To branch the program sequence to another page, the pset instruction is required immediately before a branch instruction (jp or call) is executed. Since the location of relocatable sections is not decided until the linking process is completed, the linker has a function that automatically inserts, removes or corrects the pset codes. This makes it possible to omit the pset instruction in the source.
CHAPTER 6: LINKER 6.12 Error/Warning Messages 6.12.1 Errors When an error occurs, the linker will immediately terminate the processing after displaying an error message. No object file will be output. Other files will be delivered only in the part which was processed prior to the occurrence of the error. The error messages are given below.
CHAPTER 6: LINKER 6.13 Precautions (1) Upper limits, such as a maximum section count and the number of objects to be linked, depend on the free memory space. (2) The -dr option (disabling pset deletion) is provided to keep compatibility with the older assembler asm62XX. It must be specified to create the same object as one that is created with the asm62XX. (3) To load the absolute object file created by the linker to the debugger, the same ICE parameter file must be specified when the debugger is invoked.
CHAPTER 7: HEX CONVERTER CHAPTER 7 HEX CONVERTER This chapter will describe the functions of Hex Converter hx62. 7.1 Functions Hex Converter hx62 converts an absolute object file in IEEE-695 format output from the linker into a hex file in Intel-HEX format or Motorola-S format. This conversion is needed when debugging the program with the ROM or when creating mask data using the mask data checker provided for each model.
CHAPTER 7: HEX CONVERTER 7.3 Starting Method General form of command line hx62 ^ [Options] ^ ^ ^ denotes a space. [ ] indicates the possibility to omit. The order of options and file names can be arbitrary. File names Absolute object file: .abs ICE parameter file: .par The extension of an absolute object file can be omitted. The ICE parameter file must be specified with its extension.
CHAPTER 7: HEX CONVERTER 7.4 Messages The hex converter delivers all its messages via the Standard Output (stdout). Start-up message The hex converter outputs only the following message when it starts up. Hex converter 62 Ver x.xx Copyright (C) SEIKO EPSON CORP. 199x End message The hex converter outputs the following messages to indicate which files have been created when it ends normally. Created hex file H.HEX Created hex file L.HEX Created error log file HX62.
CHAPTER 7: HEX CONVERTER 7.5 Output Hex Files 7.5.1 Hex File Configuration Since each S1C6200 instruction has a 12-bit code, the hex converter always generates two hex files for the high-order data and the low-order data. The low-order data hex file ("l.hex" or ".lsa") contains the low-order bytes (bits 7 to 0) of the object codes. The high-order data hex file ("h.hex" or ".hsa") contains the high-order bytes (bits 11 to 8 suffixed by highorder bits 0b0000).
CHAPTER 7: HEX CONVERTER 7.5.3 Motorola-S Format The hex converter converts an absolute object file in the IEEE-695 format into the Motorola-S2 format files when the -m option is specified. The high-order data file is generated with an extension ".hsa", and the low-order data file is generated with an extension ".lsa".
CHAPTER 7: HEX CONVERTER 7.6 Error/Warning Messages 7.6.1 Errors When an error occurs, the hex converter immediately terminates the processing after displaying an error message. It will not output hex files. The hex converter error messages are given below.
CHAPTER 7: HEX CONVERTER 7.7 Precautions (1) When creating the hex files for making the mask data file in the mask data checker, specify Intel-HEX format and convert for the entire available memory range of the model (do not specify the -b and -m options). Otherwise, an error will occur in the mask data checker. Refer to the development Tool manual of each model for details of the mask data checker. (2) The ICE and Evaluation Board support 4 types of ROMs: 2764, 27128, 27256 and 27512.
CHAPTER 8: DISASSEMBLER CHAPTER 8 DISASSEMBLER This chapter will describe the functions of the Disassembler ds62. 8.1 Functions The Disassembler ds62 inputs an object file in IEEE-695 or Intel-HEX format, and disassembles the codes to mnemonics. The results are output as a source file. The restored source file can be processed in the assembler/linker/hex converter to obtain the same object or hex file. 8.
CHAPTER 8: DISASSEMBLER 8.3 Starting Method General form of command line ds62 ^ [Options] ^ ^ ^ denotes a space. [ ] indicates the possibility to omit. File names Absolute object file: .abs Intel-HEX files: h.hex, l.hex ICE parameter file: .par The input files must be specified with their extension. The Intel-HEX files can be specified with either "h.hex" or "l.hex" as the extension.
CHAPTER 8: DISASSEMBLER 8.4 Messages The disassembler delivers all its messages via the Standard Output (stdout). Start-up message The hex converter outputs only the following message when it starts up. Disassembler 62 Ver x.xx Copyright (C) SEIKO EPSON CORP. 199x End message The hex converter outputs the following messages to indicate which files have been created when it ends normally. Created preprocessed source file .MS Created error log file DS62.
CHAPTER 8: DISASSEMBLER 8.5 Disassembling Output The data/code mnemonics are restored from the target code. As for the branch instructions, a label will be automatically generated like "LXXXX:" where XXXX denotes a hexadecimal number string. ".org" pseudo-instruction is used to specify the starting location of each code block. The following shows examples of disassembled sources: Sample outputs Absolute list file "test.abs" Linker 62 ver x.xx Absolute list file "TEST.
CHAPTER 8: DISASSEMBLER Output source file "test.ms" (default) ;Disassembler 62 Ver x.xx Assembly source file TEST.MS Mon May 04 11:49:34 1998 .org ld ld ld ld pset call LABEL3: pset call jp .org LABEL1: ld ld ld lbpx lbpx ret LABEL2: ld ld ld ld scf acpx acpx acpx adc ret 0x100 a,0x8 sph,a a,0x0 spl,a 0x2 LABEL1 0x2 LABEL2 LABEL3 0x200 a,0x0 xp,a x,0x0 mx,0x0 mx,0x0 a,0x0 xp,a x,0x0 a,0x0 mx,a mx,a mx,a mx,a Output source file "test.ms" (when -cl is specified) ;Disassembler 62 Ver x.
CHAPTER 8: DISASSEMBLER Output source file "test.ms" (when -cu is specified) ;Disassembler 62 Ver x.xx Assembly source file TEST.MS Mon May 04 11:51:08 1998 .ORG LD LD LD LD PSET CALL LABEL3: PSET CALL JP .
CHAPTER 8: DISASSEMBLER 8.6 Error/Warning Messages 8.6.1 Errors When an error occurs, the disassembler immediately terminates the processing after displaying an error message. It will not output a source file. The disassembler error messages are given below.
CHAPTER 9: DEBUGGER CHAPTER 9 DEBUGGER This chapter describes how to use the Debugger db62. 9.1 Features The Debugger db62 is used to debug a program after reading an object file in the IEEE-695 format that is generated by the linker. It has the following features and functions: • Various data can be referenced at the same time using multiple windows. • Frequently used commands can be executed from tool bars and menus using a mouse.
CHAPTER 9: DEBUGGER Source file File format: Text file File name: .s Description: This is the source file of the above object file. It is read when the debugger performs source display. Program file File format: HEX file in Intel-HEX format File name: h.hex, l.hex Description: This is a load image file of the program ROM, and is read into the debugger by the lo command. The file "h.hex" corresponds to the 4 high-order bits of the program code and the file "l.
CHAPTER 9: DEBUGGER 9.3 Starting Method 9.3.1 Start-up Format General form of command line db62 ^ ^ [start-up option] ^ denotes a space. [ ] indicates the possibility to omit. Note: The parameter file will be recognized by its extension ".par", so ".par" must be included in the parameter file name to be specified. 9.3.2 Start-up Options The debugger has three start up options available. Function: Specifies a command file.
CHAPTER 9: DEBUGGER 9.3.3 Start-up Messages When Debugger db62 starts up, it outputs the following message in the [Command] window. (Refer to the next section for details about windows.) Debugger for E0C62 Ver x.x Copyright (C) SEIKO EPSON CORP. 199x Connecting COMx with xxxxx baud rate...done Parameter file: XXXXX.par Chip name: E0C62XX Map....................................done Initialize.............................done > 9.3.
CHAPTER 9: DEBUGGER After initialization, the state of the screen including the position and size of the windows will return the same as the last time the debugger was terminated.
CHAPTER 9: DEBUGGER 9.4 Windows This section describes the types of windows used by the debugger. 9.4.1 Basic Structure of Window The diagram below shows the window structure of the debugger. [Source] window [Trace] window [Command] window [Register] window [Data] window Depending on the computer used, the windows may differ from the above display depending on the screen resolution, the number of dots in system font, etc. Adjust the size of each window to suit needs.
CHAPTER 9: DEBUGGER Features common to all windows (1) Open/close and activating a window All windows except [Command] can be closed or opened. To open a window, select the window name from the [View] menu. When a command is executed, the corresponding window opens if the command uses the window for displaying the executed results. To close a window, click the [Close] box on the window.
CHAPTER 9: DEBUGGER 9.4.2 [Command] Window The [Command] window is used to do the following: (1) Entering debug commands When the prompt ">" appears in the [Command] window, the system will accept a command entered from the keyboard. If some other window is selected, click on the [Command] window. A cursor will blink at the prompt, indicating that readiness to input a command. (Refer to Section 9.7.1, "Entering Commands from Keyboard".
CHAPTER 9: DEBUGGER 9.4.3 [Source] Window The [Source] window displays the contents of (1) to (3) listed below. This window also allows breakpoints to be set and words or labels to be found. (1) Unassembled codes and source codes You can choose one of the following three display modes: [Mix] button 1. Mix mode (selected by the [Mix] button or entering the m command) In this mode, the window displays the addresses, codes, unassembled contents, and corresponding source line numbers and source statements.
CHAPTER 9: DEBUGGER (2) Current PC The address line indicated by the current PC (program counter) is highlighted. (Address 0x0100 in the diagram) (3) PC breakpoint The address line where a breakpoint is set is indicated by a red ◆ mark at the beginning of the line. (Address 0x0106 in the diagram) (4) Break setting at the cursor position Place the cursor at an address line where a breakpoint is to be set (not available for a source-only line). [Break] button Then click on the [Break] button.
CHAPTER 9: DEBUGGER 9.4.4 [Data] Window (1) Displaying data memory contents The [Data] window displays the memory dump results in hexadecimal numbers.
CHAPTER 9: DEBUGGER 9.4.6 [Trace] Window The [Trace] window displays the trace result up to 8,192 cycles by reading it from the ICE's trace memory. The following lists the trace contents: • Traced cycle number • Fetched code and disassembled contents • Register contents (PC, A, B, X, Y, and flags) • Memory access status (R/W, address, data) This window also displays the trace data search results by the ts command.
CHAPTER 9: DEBUGGER 9.5 Tool Bar This section outlines the tool bar available with the debugger. 9.5.1 Tool Bar Structure The tool bar has 14 buttons, each one assigned to a frequently used command. The specified function is executed when you click on the corresponding button. 9.5.2 [Key Break] Button This button forcibly breaks execution of the target program. This function can be used to cause the program to break when the program has fallen into an endless loop. 9.5.
CHAPTER 9: DEBUGGER [Go from Reset] button This button resets the CPU and then executes the target program from the program start address (0x100). It performs the same function when the gr command is executed. [Step] button This button executes one instruction step at the address indicated by the current PC. It performs the same function when the s command is executed. [Next] button This button executes one instruction step at the address indicated by the current PC.
CHAPTER 9: DEBUGGER 9.6 Menu This section outlines the menu bar available with the debugger. 9.6.1 Menu Structure The menu bar has eight menus, each including frequently-used commands. 9.6.2 [File] Menu [Load File...] This menu item reads an object file in the IEEE-695 format into the debugger. It performs the same function when the lf command is executed. [Load Option...] This menu item reads a program or optional HEX file in Intel-HEX format into the debugger.
CHAPTER 9: DEBUGGER 9.6.4 [Break] Menu [Breakpoint Set...] This menu item displays, sets or clears PC breakpoints using a dialog box. It performs the same function as executing the bp command. [Data Break...] This menu item displays, sets or clears data break conditions using a dialog box. It performs the same function as executing the bd command. [Register Break...] This menu item displays, sets or clears register break conditions using a dialog box.
CHAPTER 9: DEBUGGER [Register] This menu item opens or activates the [Register] window and displays the current values of the registers. [Trace] This menu item opens or activates the [Trace] window and displays the trace data sampled in the ICE trace memory. [Toolbar] This menu item shows or hides the toolbar. [Status Bar] This menu item shows or hides the status bar. 9.6.7 [Option] Menu [Log...] This menu item starts or stops logging using a dialog box.
CHAPTER 9: DEBUGGER 9.7 Method for Executing Commands All debug functions can be performed by executing debug commands. This section describes how to execute these commands. Refer to the description of each command for command parameters and other details. To execute a debug command, activate the [Command] window and input the command from the keyboard. The menu and tool bar can be used to execute frequently-used commands. 9.7.
CHAPTER 9: DEBUGGER • Commands that replace existing data after confirmation The commands that rewrite memory or register contents one by one provide the option of skipping guidance (do not modify the contents), returning to the immediately preceding guidance, or terminating during the input session. [Enter] key ......... Skips input. [^] key ................ Returns to the immediately preceding guidance. [q] key ................ Terminates the input session.
CHAPTER 9: DEBUGGER 9.7.2 Executing from Menu or Tool Bar The menu and tool bar are assigned frequently-used commands as described in Sections 9.5 and 9.6. A command can be executed simply by selecting desired menu command or clicking on the tool bar button. Table 9.7.2.1 lists the commands assigned to the menu and tool bar. Table 9.7.2.
CHAPTER 9: DEBUGGER 9.7.3 Executing from a Command File Another method for executing commands is to use a command file that contains descriptions of a series of debug commands. By reading a command file into the debugger the commands written in it can be executed. Creating a command file Create a command file as a text file using an editor. Although there are no specific restrictions on the extension of a file name, Seiko Epson recommends using ".cmd".
CHAPTER 9: DEBUGGER 9.7.4 Log File The executed commands and the execution results can be saved to a file in text format that is called a "log file". This file allows verification of the debug procedures and contents. The contents displayed in the [Command] window are saved to this file. Command example >log tst.
CHAPTER 9: DEBUGGER 9.8 Debug Functions This section outlines the debug features of the debugger, classified by function. Refer to Section 9.9, "Command Reference" for details about each debug command. 9.8.1 Loading Program and Option Data Loading files The debugger can read a file in IEEE-695 format or Intel-HEX format in the debugging process. Table 9.8.1.1 lists the files that can be read by the debugger and the load commands. Table 9.8.1.1 Files and load commands File type Data type Ext.
CHAPTER 9: DEBUGGER 9.8.2 Source Display and Symbolic Debugging Function The debugger allows program debugging while displaying the assembly source statements. Address specification using a symbol name is also possible. Displaying program code The [Source] window displays the program in the specified display mode. The display mode can be selected from among the three modes: Unassemble mode, Source mode, Mix mode. Table 9.8.2.
CHAPTER 9: DEBUGGER (3) Mix mode In this mode, both unassembled codes and sources are displayed like an absolute list. This mode is available only when an absolute object file that contains source debugging information has been loaded. Refer to Section 9.4.3, "[Source] Window" for details about the display contents. Symbol reference When debugging a program after reading an object file in IEEE-695 format, the symbols defined in the source file can be used to specify an address.
CHAPTER 9: DEBUGGER 9.8.3 Displaying and Modifying Program, Data, and Register The debugger has functions to operate on the program memory, data memory, and registers. Each memory area is set to the debugger according to the map information that is given in a parameter file. Operating on program memory area The following operations can be performed on the program memory area: Table 9.8.3.
CHAPTER 9: DEBUGGER Operating registers The following operations can be performed on registers: Table 9.8.3.3 Commands/menu items to operate registers Function Displaying registers Modifying register values Command rd rs Menu [View | Register] – (1) Displaying registers Register contents can be displayed in the [Register] or [Command] window. Registers: PC, A, B, X, Y, SP and IDZC flags While the program is being executed, the PC address is updated in real time every 0.
CHAPTER 9: DEBUGGER 9.8.4 Executing Program The debugger can execute the target program successively or execute instructions one step at a time (single-stepping). Successive execution (1) Types of successive execution There are two types of successive execution available: • Successive execution from the current PC • Successive execution from the program start address (0x0100) after resetting the CPU Table 9.8.4.
CHAPTER 9: DEBUGGER Single-stepping (1) Types of single-stepping There are two types of single-stepping available: • Stepping through all instructions (STEP) All instructions are executed one step at a time according to the PC, regardless of the type of instruction. • Stepping through instructions except subroutines (NEXT) The call and calz instructions are executed under the assumption that one step constitutes the range of statements until control is returned to the next step by a return instruction.
CHAPTER 9: DEBUGGER 9.8.5 Break Functions The target program is made to stop executing by one of the following causes: • Break command conditions are satisfied. • The [Key Break] button is clicked or the [Esc] key is pressed. • The [Break] or [Reset] switch on the ICE is pushed. Break by command The debugger has four types of break functions that allow the break conditions to be set by a command. When the set conditions in one of these break functions are met, the program under execution is made to break.
CHAPTER 9: DEBUGGER (3) Register break This break function causes a break when the A, B, X, Y, and flag (IDZC) registers reach a specified value. Each register can be masked (so they are not included in break conditions). The flag register can be masked in bit units. A break occurs when the above registers are modified to satisfy all set conditions. Table 9.8.5.
CHAPTER 9: DEBUGGER 9.8.6 Trace Functions The debugger has a function to trace program execution. Trace memory and trace information The ICE contains a trace memory. When the program executes instructions in the trace range set by a command, the trace information on each cycle is taken into this memory. The trace memory has the capacity to store information for 8,192 cycles, making it possible to trace up to 2,730 instructions (for five-clock instructions only).
CHAPTER 9: DEBUGGER (2) Trace condition The trace starts when the target program starts executing and ends relative to an instruction that generates a break set by a break command (bp, bd, br or bm). The trace range is decided according to the trace condition that can be selected from the three positions shown below: • Start The trace is halted after sampling trace information for 8,192 cycles beginning from the first-hit break point.
CHAPTER 9: DEBUGGER It is possible to specify a search condition and display the trace information that matches a specified condition. The search condition can be selected from the following three: 1. Program's execution address 2. Address from which data is read 3. Address to which data is written When the above condition and one address are specified, the system starts searching.
CHAPTER 9: DEBUGGER 9.8.7 Coverage The ICE retains coverage information (i.e., information on addresses at which a program is executed) and it can be displayed in the [Command] window. Because the executed address range is displayed as shown below, it is possible to know which areas have not been executed. Coverage Information: 0: 0100..0108 1: 0200..020f Table 9.8.7.
CHAPTER 9: DEBUGGER 9.9 Command Reference 9.9.1 Command List Table 9.9.1.1 lists the debug commands available with the debugger. Table 9.9.1.
CHAPTER 9: DEBUGGER 9.9.2 Reference for Each Command The following sections explain all the commands by functions. The explanations contain the following items. Function Indicates the functions of the command. Format Indicates the keyboard input format and parameters required for execution. Example Indicates a sample execution of the command. Note Shows notes on using. GUI utility Indicates a menu item or tool bar button if they are available for the command.
CHAPTER 9: DEBUGGER 9.9.3 Program Memory Operation as (assemble mnemonic) Function This command assembles the input mnemonic and rewrites the corresponding code to the program memory at the specified address. Format >as↵ (guidance mode) Start address ? :
↵ Address Original code Original mnemonic : ↵ ..........CHAPTER 9: DEBUGGER • When the contents of the program memory are modified using the as command in direct mode, the unassemble contents of the [Source] window are updated immediately. When it is done in guidance mode, the unassemble contents of the [Source] window are updated immediately in unassemble display mode, but will be updated when the "q↵" is input to terminate the command in mix display mode.
CHAPTER 9: DEBUGGER pe (program memory enter) Function This command rewrites the contents of the specified address in the program memory with the input hexadecimal code. Format >pe↵ (guidance mode) Program enter address ?
↵ Address Original code : ↵ ..........CHAPTER 9: DEBUGGER pf (program memory fill) Function This command rewrites the contents of the specified program memory area with the specified code.
CHAPTER 9: DEBUGGER pm (program memory move) Function This command copies the content of a specified program memory area to another area.
CHAPTER 9: DEBUGGER 9.9.4 Data Memory Operation dd (data memory dump) Function This command displays the content of the data memory in a 16 words/line hexadecimal dump format.
CHAPTER 9: DEBUGGER If only is defined, the debugger displays data for 256 words from . >dd 008↵ 0 1 2 3 4 5 6 7 8 9 A B C D E F 0000: 0 0 0 0 0 0 0 0 0010: 0 0 0 0 0 0 0 0 0 0 0 0 0 0 0 0 0020: 0 0 0 0 0 0 0 0 0 0 0 0 0 0 0 0 : : : 00e0:!0 0 f 0 / / / / / / / / / / / / 00f0:!0!0!0!0!0 / / / 0 0 0 0 0 / / / 0100: 0 0 0 0 0 0 0 0 > If both and are defined, the debugger displays data from to .
CHAPTER 9: DEBUGGER de (data memory enter) Function This command rewrites the contents of the data memory with the input hexadecimal data. Data can be written to continuous memory locations beginning with a specified address. Format (1) >de
[ [...]]↵ (direct input mode) (2) >de↵ (guidance mode) Data enter address ? ↵ Address Original data : ↵ ..........CHAPTER 9: DEBUGGER • In guidance mode, the following keyboard inputs have special meaning: "q↵" … Command is terminated. (finish inputting and start execution) "^↵" … Return to previous address. "↵" … Input is skipped. (keep current value) If the maximum address of data memory is reached and gets a valid input other than "^↵", the command is terminated. GUI utility [Data] window The [Data] window allows direct modification of data.
CHAPTER 9: DEBUGGER df (data memory fill) Function This command rewrites the contents of the specified data memory area with the specified data.
CHAPTER 9: DEBUGGER dm (data memory move) Function This command copies the contents of the specified data memory area to another area.
CHAPTER 9: DEBUGGER 9.9.5 Register Operation rd (register display) Function This command displays the contents of the registers, current and next operation code and corresponding mnemonic. Format >rd↵ (direct input mode) Display (1) Contents of display The following lists the contents displayed by this command.
CHAPTER 9: DEBUGGER rs (register set) Function This command modifies the register values. Format (1) >rs [ [...
CHAPTER 9: DEBUGGER 9.9.6 Program Execution g (go) Function This command executes the target program from the current PC position. Format >g [
]↵ (direct input mode) : Temporary break addresses; hexadecimal or symbol (IEEE-695 format only) Condition: 0 ≤ address ≤ last program memory address Operation The target program is executed from the address indicated by the PC.CHAPTER 9: DEBUGGER GUI utility [Run | Go] menu item, [Go] button When this menu item or button is selected, the g command without temporary break is executed. [Go] button [Run | Go to Cursor] menu item, [Go to Cursor] button When this menu item or button is selected after placing the cursor to the temporary break address line in the [Source] window, the g command with a temporary break is executed. The program execution will be suspended after executing the address at the cursor position.
CHAPTER 9: DEBUGGER gr (go after reset CPU) Function This command executes the target program from the boot address after resetting the CPU. Format >gr↵ (direct input mode) Operation This command resets the CPU before executing the program. This causes the PC to be set at address 0x100, from which the command starts executing the program. Once the program starts executing, the command operates in the same way as the g command.
CHAPTER 9: DEBUGGER s (step) Function This command single-steps the target program from the current PC position by executing one instruction at a time. Format >s []↵ (direct input mode) : Number of steps to be executed; decimal (default is 1) Condition: 0 ≤ step ≤ 65,535 Operation If the is omitted, only the program step at the address indicated by the PC is executed, otherwise the specified number of program steps is executed from the address indicated by the PC. >s↵ ...
CHAPTER 9: DEBUGGER n (next) Function This command single-steps the target program from the current PC position by executing one instruction at a time. Format >n []↵ (direct input mode) : Number of steps to be executed; decimal (default is 1) Condition: 0 ≤ step ≤ 65,535 Operation This command basically operates in the same way as the s command. However, the call and calz instructions, including all subroutines until control returns to the next address, are executed as one step.
CHAPTER 9: DEBUGGER 9.9.7 CPU Reset rst (reset CPU) Function This command resets the CPU. Format >rst↵ (direct input mode) Notes • The registers and flags are set as follows: PC 0x0100 A Undefined B Undefined X Undefined Y Undefined I 0 D Undefined (S1C6200) or 0 (S1C6200A) Z Undefined C Undefined SP Undefined • If the [Source] window is opened, the window is redisplayed beginning with address 0x0100. If the [Register] window is opened, the window is redisplayed with the above contents.
CHAPTER 9: DEBUGGER 9.9.8 Break bp (break point set) Function This command sets or clears breakpoints using a program's execution address or address ranges. Format (1) >bp [ [ []]]↵ (direct input mode) (2) >bp↵ (guidance mode) PC break set status 1. set 2. clear 3. clear all ... ? <1 | 2 | 3>↵ ..........
CHAPTER 9: DEBUGGER • For direct input mode, an error results if you attempt to set breakpoints at more than 4 locations at a time. But for guidance mode, there is no such limitation, so you can specify more than 4 PC breaks before terminating the command by the [Enter] key. • You can use this command for multiple times to set new breakpoints. • Do not set a breakpoint to the address in which the EI instruction is located, as it will interfere with interrupt operations. GUI utility [Break | Breakpoint Set.
CHAPTER 9: DEBUGGER bpc (break point clear) Function This command clears the specified breakpoints that have been set. Format >bpc [ [ []]]↵ (direct input mode) : Break address or address area; hexadecimal or symbol (IEEE-695 format only) Example >bp↵ 0: 0100 1: 0200..0300 1. set 2. clear >bpc 100 150..250↵ >bp↵ 0 : 0251..0300 1. set 2. clear > ... Break points that have been set 3. clear all ... ? ↵ ...
CHAPTER 9: DEBUGGER bd (data break) Function This command sets or clears data break. This command allows you to specify the following break conditions: 1. Memory address to be read or written (one location) 2. Data pattern to be read or written (bit mask possible) 3. Memory read/write (three conditions: read, write, or read or write) The program breaks after completing a memory access that satisfies the above conditions.
CHAPTER 9: DEBUGGER Notes • For the first time this command is executed, no item can be skipped because no default value is set. • In guidance mode, the following keyboard inputs have special meaning: "q↵" … Command is terminated. (finish inputting and start execution) "^↵" … Return to previous address. "↵" … Input is skipped. (keep current value) When the command is terminated in the middle of guidance by "q↵", the contents that have been input up to that time will be modified.
CHAPTER 9: DEBUGGER bdc (data break clear) Function This command clears the data break condition that has been set. Format >bdc↵ (direct input mode) GUI utility [Break | Data Break …] menu item When this menu item is selected, a dialog box appears for clearing the set data break condition. (See the bd command.
CHAPTER 9: DEBUGGER br (register break) Function This command sets or clears register break. This command allows you to specify data or a mask that constitutes a break condition for each register (A, B, F, X, and Y). The program will break when all setting conditions are met. Format (1) >br [ [... ]]↵ (direct input mode) (2) >br↵ (guidance mode) Register break set status 1. set 2. clear …? <1 | 2>↵ (Command is completed when "2" is selected.
CHAPTER 9: DEBUGGER Notes • For the first time this command is executed, no item can be skipped because no default value is set. • In guidance mode, the following keyboard inputs have special meaning: "q↵" … Command is terminated. (finish inputting and start execution) "^↵" … Return to previous address. "↵" … Input is skipped. (keep current value) When the command is terminated in the middle of guidance by "q↵", the contents that have been input up to that time will be modified.
CHAPTER 9: DEBUGGER brc (register break clear) Function This command clears the register break conditions that have been set. Format >brc↵ (direct input mode) GUI utility [Break | Register Break …] menu item When this menu item is selected, a dialog box appears for clearing the register break conditions. (See the br command.
CHAPTER 9: DEBUGGER bm (multiple break) Function This command sets or clears multiple break conditions combined with a PC, data RAM access and register breaks. Format (1) >bm - [
- [...
- ]]↵ (direct input mode) (2) >bm↵ (guidance mode) Multiple break set status 1. set 2. clear …? <1 | 2>↵ (Command is completed when "2" is selected.
CHAPTER 9: DEBUGGER Notes • For the first time this command is executed, no item can be skipped because no default value is set. • A multiple break will occur when all the conditions for the PC, data RAM access, and register values coincide. • The previously set PC break, data break and register break conditions are cleared by the bm command. Also, the multiple break setting is cleared when the bp, bd and/or br conditions are set after the bm condition is set.
CHAPTER 9: DEBUGGER bmc (multiple break clear) Function This command clears the multiple break condition that has been set. Format >bmc↵ (direct input mode) GUI utility [Break | Multi Break …] menu item When this menu item is selected, a dialog box appears for clearing multi break conditions. (See the bm command.
CHAPTER 9: DEBUGGER bl (break point list) Function This command lists the current setting of all break conditions. Format >bl↵ (direct input mode) Example >bl↵ Data Break Condition: ADDR : 100 DATA: 1*1*B R/W: * Register Break Condition: A:A B:* X:060 Y:* IDZC:1*0*B PC Break List: 0: 0100 1: 0200..
CHAPTER 9: DEBUGGER bac (break all clear) Function This command clears all break conditions set by the bp, bd, br and/or bm commands. Format >bac↵ (direct input mode) GUI utility [Break | Break All Clear] menu item When this menu item is selected, the bac command is executed.
CHAPTER 9: DEBUGGER be (break enable) Function This command sets the break enable mode. A break is generated when the PC break, data break, register break or multi break condition is met with the Evaluation Board CPU state. Format >be↵ (direct input mode) Example >be↵ Set to break enable mode. GUI utility [Option | Mode Setting …] menu item When this menu item is selected, a dialog box appears for setting break enable mode. Select the [Break Enable] button.
CHAPTER 9: DEBUGGER bsyn (break disable) Function This command sets the break disable (synchronous) mode. When the PC break, data break, register break or multi break condition is met with the Evaluation Board CPU state, a pulse is output to the ICE SYNC pin. However, a break is not generated. Format >bsyn↵ (direct input mode) Example >bsyn↵ Set to break disable (synchronous) mode.
CHAPTER 9: DEBUGGER 9.9.9 Program Display u (unassemble) Function This command displays a program in the [Source] window after unassembling it. The display contents are as follows: • Program memory address • Object code • Unassembled contents of the program Format >u [
]↵ (direct input mode) : Start address for display; hexadecimal or symbol (IEEE-695 format only) Condition: 0 ≤ address ≤ last program memory address Display When the [Source] window is opened, the display is refreshed.CHAPTER 9: DEBUGGER sc (source code) Function This command displays the contents of the program source file in the [Source] window. The display contents are as follows: • Line number in the source file • Source code Format >sc [
] ↵ (direct input mode) : Start address for display; hexadecimal or symbol (IEEE-695 format only) Condition: 0 ≤ address ≤ last program memory address Display When the [Source] window is opened, the display is refreshed.CHAPTER 9: DEBUGGER m (mix) Function This command displays the unassembled result of the program and the contents of the program source file in the [Source] window.
CHAPTER 9: DEBUGGER 9.9.10 Symbol Information sy (symbol list) Function This command displays a list of symbols in the [Command] window. Format (1) >sy [/a]↵ (2) >sy $ [/a]↵ (3) >sy # [/a]↵ (direct input mode) (direct input mode) (direct input mode) : Search character string; ASCII character Condition: 0 ≤ length of keyword ≤ 32 Examples Format (1) >sy↵ INC_RAM_BLK1 INIT_RAM_BLK1 RAM_BLK1 BOOT@C:\E0C62\TEST\MAIN.S LOOP@C:\E0C62\TEST\MAIN.
CHAPTER 9: DEBUGGER 9.9.11 Load File lf (load file) Function This command loads an object file in IEEE-695 format into the debugger. Format (1) >lf ↵ (direct input mode) (2) >lf↵ (guidance mode) File Name ? ↵ > : File name to be loaded (path can also be specified) Examples Format (1) >lf test.abs↵ Loading file ... OK! > Format (2) >lf↵ File name ? test.abs Loading file ...
CHAPTER 9: DEBUGGER lo (load option) Function This command loads an Intel HEX format program or option file listed below into the debugger. File Program file Function option data file Segment option data file Melody data file* Name specification ~h.hex (4 high-order bits), ~l.hex (8 low-order bits) ~f.hex ~s.hex ~a.hex ∗ Not used in some microcomputer models Format (1) >lo ↵ (direct input mode) (2) >lo↵ (guidance mode) File Name ...
CHAPTER 9: DEBUGGER 9.9.12 ROM Access rp (ROM program load) Function This command loads program to ICE's emulation memory from the ROM at the ICE ROM socket. Format >rp↵ (direct input mode) Notes • An error results if high and/or low ROM chips are not installed, and so the program is not loaded to the emulation memory. Error : no low ROM. Error : no high ROM. Error : no high and low ROM. • An error results when an undefined code is detected, and the execution is terminated.
CHAPTER 9: DEBUGGER vp (ROM program verify) Function This command verifies the contents of the ICE emulation memory and the ROM at the ICE ROM socket. Format >vp↵ (direct input mode) Notes • An error results if high and/or low ROM chips are not installed. Error : no low ROM. Error : no high ROM. Error : no high and low ROM. • If there is any non-agreeing data, it (ROM address, ROM contents, emulation memory contents) is displayed in the [Command] window. >vp↵ Rom verifying ...
CHAPTER 9: DEBUGGER rom (ROM type) Function This command specifies the type of the ROM chip which is installed to the ICE ROM socket. Format (1) >rom ↵ (direct input mode) (2) >rom↵ (guidance mode) rom Current type setting : ↵ > : Value indicating the ROM type; 64/128/256/512 Examples Format (1) >rom 64↵ > Format (2) >rom↵ ROM 64 : 256↵ > ... 2764 type ROM is specified. ... 27256 type ROM is specified. Notes • The initial value is set as 64.
CHAPTER 9: DEBUGGER 9.9.13 Trace tc (trace condition) Function This command sets up the trace condition by means of the break point. One of the following three trace conditions can be specified with respect to the break point: Start: Extract the trace information from the break point. Middle: Extract the trace information before and after the break point. End: Extract the trace information up to the break point.
CHAPTER 9: DEBUGGER ta (trace area) Function This command sets or clears the trace area by the specified program address range. Format (1) >ta [ [...... ]]↵ (direct input mode) (2) >ta all↵ (direct input mode) (3) >ta↵ (guidance mode) Current trace area 1. set 2. clear 3. clear all ...? <1 | 2 | 3>↵ Start address ? ↵ End address ? ↵ ......
CHAPTER 9: DEBUGGER Notes • The addresses must be specified within the range of the program memory area available for each microcomputer model. An error results if the input one is not a hexadecimal number or a valid symbol. Error : invalid value. An error results if the limit is exceeded. Error : Program address out of range. • An error results if the start address is larger than the end address. Error : end address < start address. • You can set all program area as trace area using format (2).
CHAPTER 9: DEBUGGER tac (trace area clear) Function This command clears program address ranges from the trace area. Format >tac [ [...
CHAPTER 9: DEBUGGER tp (trace pointer) Function This command displays the current location of the trace pointer. The pointer points to the location in the trace memory into which the last trace information has been stored. Format >tp↵ Example >tp↵ LOC=2058 > (direct input mode) ...
CHAPTER 9: DEBUGGER td (trace data display) Function This command displays the trace information that has been sampled into the ICE's trace memory.
CHAPTER 9: DEBUGGER (2) When [Trace] window is closed: When the td command is input without , the debugger displays 11 lines of the latest trace data in the [Command] window. When the td command is input with , the debugger displays 11 lines of the trace data from in the [Command] window.
CHAPTER 9: DEBUGGER ts (trace search) Function This command searches trace information from the trace memory under a specified condition. The search condition can be selected from three available conditions: 1. Search by executed address In this mode, you can specify a program memory address. The debugger searches the cycle in which the specified address is executed. 2. Search for a specified memory read cycle In this mode, you can specify a data memory address.
CHAPTER 9: DEBUGGER Note The address specified for search must be within the range of the program/data memory area available for each microcomputer model. An error results if the input one is not a hexadecimal number or not a valid symbol. Error : invalid value. An error results if the limit is exceeded for program memory address. Error : Program address out of range. An error results if the limit is exceeded for data memory address. Error : Data address out of range.
CHAPTER 9: DEBUGGER tf (trace file) Function This command saves the specified range of the trace information displayed in the [Trace] window by the td command to a file. Format (1) >tf [ ] ↵ (direct input mode) (2) >tf↵ (guidance mode) Start pointer ? ↵ End pointer ? ↵ File Name ? ↵ > : Start pointer; decimal (min 0) : End pointer; decimal (max 2,730) : Output file name (path can also be specified) Examples Format (1) >tf trace.trc↵ .
CHAPTER 9: DEBUGGER 9.9.14 Coverage cv (coverage) Function This command displays coverage information (addresses where the program is executed). The coverage information is displayed in the [Command] window. Format >cv [ []]↵ (direct input mode) : Start address; hexadecimal or symbol (IEEE-695 format only) : End address; hexadecimal or symbol (IEEE-695 format only) Condition: 0 ≤ address1 ≤ address2 ≤ last program memory address Example >cv 100 1ff↵ ...
CHAPTER 9: DEBUGGER cvc (coverage clear) Function This command clears the coverage information.
CHAPTER 9: DEBUGGER 9.9.15 Command File com (execute command file) Function This command reads a command file and executes the debug commands written in that file. You can execute the commands successively, or set an interval between each command execution. Format (1) >com []↵ (direct input mode) (2) >com↵ (guidance mode) File name ? ↵ Execute commands 1. successively 2. With wait ...? <1 | 2>↵ Interval (0 - 30 seconds) : ↵ (appears only when "2.
CHAPTER 9: DEBUGGER rec (record commands to a file) Function This command records all debug commands following this command to a specified command file. Format (1) >rec ↵ (direct input mode) (2) >rec↵ (guidance mode) ... See Examples for guidance. : Command file name (path can also be specified) Examples (1) First rec execution after debugger starts up >rec↵ File name 1. append > ? sample.cmd↵ 2. clear and open ...? 2↵ ... Displayed if the file is already exists.
CHAPTER 9: DEBUGGER 9.9.16 log log (log) Function This command saves the input commands and the execution results to a file. Format (1) >log ↵ (direct input mode) (2) >log↵ (guidance mode) ... See Examples for guidance. : Log file name (path can also be specified) Examples (1) First log execution after debugger starts up >log↵ File name 1. append > ? debug1.log↵ 2. clear and open ...? 2↵ ... Displayed if the file is already exists.
CHAPTER 9: DEBUGGER 9.9.17 Map Information ma (map information) Function This command displays the map information that is set by a parameter file. Format >ma↵ (direct input mode) Example >ma↵ Map Information: Rom Size :1000 Rom Start Address :0000 Rom End Address :0fff Ram Size :1000 Ram Start Address :0000 Ram End Address :0fff --I/O Area List :0080..00ff, 0180..01ff, 0280..02ff, --Segment Area List :0050..007f, 0450..047f Read Only Area :0091, 0095, 00c9, 00ca, 00f8..
CHAPTER 9: DEBUGGER 9.9.18 Mode Setting otf (on-the-fly display) Function This command selects whether or not to run the on-the-fly display during target program execution by the g (go) or gr (go after reset) command. Format >otf↵ (direct input mode) Example >otf↵ Set on-the-fly display off. ... This command toggles the on-the-fly display function. >otf↵ Set on-the-fly display on. Note The on-the-fly display is turned on at power on by default.
CHAPTER 9: DEBUGGER tim (time or step mode) Function This command selects a measurement mode of the execution counter during target program execution by the g (go) or gr (go after reset) command. Either execution time count mode or step count mode can be selected. Format >tim↵ (direct input mode) Example >tim↵ Set step count mode. >tim↵ Set real time count mode. > ... This command toggles the measurement mode. Note The execution time count mode is set at power on by default.
CHAPTER 9: DEBUGGER 9.9.19 Self Diagnosis chk (self diagnostic test) Function This command displays the results of the ICE initial test. The test consists of the following items: (1) Sum check test of ICE firmware (2) ICE RAM read/write test Format >chk↵ (direct input mode) Display • If a ROM check error is detected, the normal value and the error value will be displayed. >chk↵ ROM check error: 5F => FF. ...
CHAPTER 9: DEBUGGER 9.9.20 Quit q (quit) Function This command quits the debugger. Format >q↵ (direct input mode) GUI utility [File | Exit] menu item Selecting this menu item terminates the debugger.
CHAPTER 9: DEBUGGER 9.10 Error/Warning Messages 1. ICE errors Error message Error : communication error Error : ID not match Error : ROM sum check error Error : RAM check error Error : undefined code detected Content of message There is a probrem in communication between Host and ICE. ICE protocol ID error ICE62 firmware ROM sum error found during self diagnostic test. ICE62 firmware RAM errorfound during self diagnostic test. Some undefined code is detected when loading file. 2.
S1C62 Family Assembler Package Quick Reference
Memory Map S1C6200 Core CPU Program Memory Map Bank 0 Page 0 Page 1 Data Memory Map Step 0x0 0x1 Page 1, Bank 0 Program start address Page 0 Page 1 Address 0x00 0x10 Interrupt vector area RAM Display memory I/O memory 0xf CMOS 4-bit Single Chip Microcomputer S1C62 Family Assembler Package Page 15 Quick Reference for Development Program area 0xff Bank 1 Page 0 Page 1 Interrupt vector area 0xf 0xff Address 0x00 (Maximum configulation) 0xff Other pages RAM Display memory I/O memory 4 bi
Instruction List (1) S1C6200 Core CPU Symbols in the Instruction List Registers/Register Data Functions A: B: X: XP: XH: XL: Y: YP: YH: YL: F: SP: SPH: SPL: NBP: NPP: PCB: PCP: PCS: PCSH: PCSL: ←: +: -: &: |: ^: !: Data register A or its contents (4 bits) Data register B or its contents (4 bits) Register XHL or its contents (8 low-order bits of the IX register) Register XP or its contents (4 high-order bits of the IX register) Register XH or its contents (4 high-order bits of the XHL register) Registe
Instruction List (2) Clasiffication Branch instructions System control instructions Index operation instructions Remarks Mnemonic Opcode Operand PSET p JP s C, s NC, s Z, s NZ, s JPBA CALL s CALZ s RET RETS RETD l NOP5 NOP7 HALT SLP INC X Y LD X, x Y, y XP, r XH, r XL, r YP, r YH, r YL, r r, XP r, XH r, XL r, YP r, YH r, YL ADC XH, i XL, i YH, i YL, i S1C6200 Core CPU MSB 1 1 0 0 0 0 0 0 0 1 0 1 1 1 0 1 0 1 1 1 1 1 0 0 1 1 1 1 1 1 1 1 1 1 1 1 1 0 1 0 1 1 1 1 1 1 1 1 1 1 1 1 1 1 1 1 1 1 1 1 1 1 1 1 1 0 1
Instruction List (3) Clasiffication Index operation instructions Data transfer instructions Flag operation instructions Stack operation instructions Remarks Mnemonic Opcode Operand CP XH, i XL, i YH, i YL, i LD r, i r, q A, Mn B, Mn Mn, A Mn, B LDPX MX, i r, q LDPY MY, i r, q LBPX MX, l SET F, i RST F, i SCF RCF SZF RZF SDF RDF EI DI INC SP DEC SP PUSH r XP XH XL YP YH YL F POP r S1C6200 Core CPU MSB 1 0 1 0 1 0 1 0 1 1 1 1 1 1 1 1 1 1 1 1 1 1 1 1 1 1 1 1 1 0 1 1 1 1 1 1 1 1 1 1 1 1 1 1 1 1 1 1 1 1 1 1
Instruction List (4) Mnemonic Clasiffication Opcode Operand Stack POP XP operation XH instructions XL YP YH YL F LD SPH, r SPL, r r, SPH r, SPL Arithmetic ADD r, i operation r, q instructions ADC r, i r, q SUB r, q SBC r, i r, q AND r, i r, q OR r, i r, q XOR r, i r, q CP r, i r, q FAN r, i r, q RLC r RRC r INC Mn DEC Mn ACPX MX, r ACPY MY, r SCPX MX, r SCPY MY, r NOT r Remarks S1C6200 Core CPU MSB 1 1 1 1 1 1 1 1 1 1 1 1 1 1 1 1 1 1 1 1 1 1 1 1 1 0 1 1 1 0 1 0 1 1 1 0 1 1 1 0 1 1 1 0 1 1 1 0 1 1 1 1 1 1 1
Software Development Flowchart Development Tools Work Bench wb62 Make file file.MAK Development tools for each model file.S Assembly source file(s) or file.DAT file.par Function Option Generator fog62XX Assembler fileF.HEX as62 Assembly list file(s) file.LST Linker command file file.O Function option HEX file file.MS Object file(s) Preprocessed source file(s) file.CM fileF.DOC Function option document file file.SEG Segment option source file Segment Option Generator sog62XX Linker 1.
Work Bench wb62 (1) Development Tools Outline The work bench provides an integrated development environment with Windows GUI. Creating/editing source files, selecting files and major startup options, and the startup of each tool can be made with simple Windows operations. Window [Project] window This window shows the currently opened work space folder and lists all the source files in the project, with a structure similar to Windows Explorer.
Work Bench wb62 (2) Development Tools Tool bars [Standard] tool bar [Build] tool bar [New] button Creates a new document (source, header or project). [HEX Convert] button Invokes the HEX converter. [Open] button Opens a document (source, header or project). [Disassemble] button Invokes the disassembler. [Save] button Saves the document in the active [Edit] window to the file. The file will be overwritten. [Debug] button Invokes the debugger with the specified ICE parameter file.
Work Bench wb62 (3) Development Tools Menus [File] menu The file names listed in this menu are recently used source and project files. Selecting one opens the file. [Edit] menu New... ([Ctrl]+[N]) [View] menu Creates a new document (source, header or project). Open... ([Ctrl]+[O]) Opens a document (source, header or project). Close Closes the active [Edit] window. Open Workspace... Opens a project. Close Workspace Closes the currently opened project.
Work Bench wb62 (4) Development Tools Menus Short-Cut Key List [Window] menu This menu appears when an [Edit] window is opened. Cascade Cascades the opened [Edit] windows. Tile Horizontally Tiles the opened [Edit] window horizontally. Tile Vertically Tiles the opened [Edit] window vertically. Arrange Icons Arranges the minimized [Edit] window icons. Close All Closes all the [Edit] windows opened. [Help] menu About WB62... Displays a dialog box showing the version of the work bench.
Assembler as62 (1) Development Tools Outline Pseudo-instructions Converts the mnemonic of the source files into object codes (machine language) of the S1C62. The results are output in a relocatable object file. This assembler includes preprocessing functions such as macro definition/call, conditional assembly, and file-include functions. Flowchart #include #define #macro #endm #ifdef Assembly source file [#else file.s #endif #ifndef [] [par] [,par] .
Assembler as62 (2) Operators + ^H ^L ~ () * / % << >> + == != < <= > >= & | ^ && || Priority Plus sign 1 Minus sign 1 Acquires 8 high-order bits 2 Acquires 8 low-order bits 2 Negation 2 Parenthesis (=3, )=11 Multiplication 4 Division 4 Residue 4 Shifting to left 4 Shifting to right 4 Addition 5 Subtraction 5 Equal (relational operator) 6 Not equal (relational operator) 6 Less than (relational operator) 6 Less than or equal (relational operator) 6 Greater than (relational operator) 6 Greater than or equal (
Linker lk62 Development Tools Outline Error Messages Links the relocatable objects created by the assembler by fixing the memory locations, and creates executable absolute object codes. The linker also provides an auto PSET insertion/correction function allowing the programmer to create sources without having to know branch destination page numbers. Flowchart from Assembler Linker Relocatable ICE command file object file(s) parameter file file.cm file.o file.par Linker lk62 file.map file.
HEX Converter hx62 Development Tools Outline Error Messages Converts an absolute object in IEEE-695 format output from the linker into ROM-image data in Intel-HEX format or Motorola-S format. This conversion is needed when making the ROM or when creating mask data using the development tools provided with each model. Flowchart from Linker Absolute object file file.abs file.
Disassembler ds62 Development Tools Outline Error Messages Disassembles an absolute object file in IEEE-695 format or a hex file in Intel-HEX format, and restores it to a source format file. The restored source file can be processed in the assembler/linker/hex converter to obtain the same object or hex file. Flowchart from Linker from Hex converter ICE parameter file IEEE-695 absolute object file file.abs fileh.hex or filel.
Debugger db62 (1) Outline This software performs debugging by controlling the ICE hardware tool. Commands that are used frequently, such as break and step, are registered on the tool bar, minimizing the necessary keyboard operations. Moreover, sources, registers, and command execution results can be displayed in multiple windows, with resultant increased efficiency in the debugging tasks. Development Tools Start-up Command Usage -Usagedb62^^[startup option] Options: command file: ...
Debugger db62 (2) Development Tools Buttons Menus Tool bar [File] menu Load File... Reads an object file in the IEEE-695 format into the debugger. Load Option... Reads a program or optional HEX file in Intel-HEX format into the debugger. Exit Terminates the debugger. [Run] menu Go Executes the target program from the address indicated by the current PC. Go to Cursor Executes the target program from the address indicated by the current PC to the cursor position in the [Source] window.
Debugger db62 (3) Development Tools Menus [Trace] menu [View] menu Trace Area... Sets or clears program address ranges for tracing. Trace Condition... Sets a trace condition (Start, Middle, End). Trace Search... Searches trace information from the trace memory. Trace File... Saves the specified range of the trace information displayed in the [Trace] window to a file. [Window] menu This menu shows the currently opened window names. Selecting one activates the window.
Debugger db62 (4) Development Tools Debug Commands Program memory operation as pe pf [ ] pm [ ] Program display Assemble mnemonic Input program code Fill program area Copy program memory u [] sc [] m [] Unassemble display Source display Mix display Symbol information Data memory operation dd [ []] de [ [ [..
Debugger db62 (5) Development Tools Debugger Messages ICE errors Error : communication error Error : ID not match Error : ROM sum check error Error : RAM check error Error : undefined code detected Command errors There is a probrem in communication between Host and ICE. ICE protocol ID error ICE62 firmware ROM sum erro found during self diagnostic test. ICE62 firmware RAM error found during self diagnostic test. Some undefined code is detected when loading file.
International Sales Operations AMERICA ASIA EPSON ELECTRONICS AMERICA, INC. EPSON (CHINA) CO., LTD. - HEADQUARTERS - 23F, Beijing Silver Tower 2# North RD DongSanHuan ChaoYang District, Beijing, CHINA Phone: 64106655 Fax: 64107319 150 River Oaks Parkway San Jose, CA 95134, U.S.A. Phone: +1-408-922-0200 Fax: +1-408-922-0238 SHANGHAI BRANCH 4F, Bldg., 27, No. 69, Gui Qing Road Caohejing, Shanghai, CHINA Phone: 21-6485-5552 Fax: 21-6485-0775 - SALES OFFICES West 1960 E.
S5U1C62000A Manual (S1C60/62 Family Assembler Package) ELECTRONIC DEVICES MARKETING DIVISION EPSON Electronic Devices Website http://www.epsondevice.