
Technical data


1-7
Specifications and Regulatory Information
Specifications and Characteristics
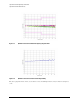
O/E Frequency Response Error for Different Reflection Coefficients
A significant error term in this measurement is the electrical port match of the device under test (DUT).
The following table lists the measurement uncertainty as a function of DUT electrical reflection coefficient.
On PORT 1 measurements, you can perform response and match calibration to achieve values comparable
to measurements of devices with
ρ = < 0.25, as shown in “Relative Frequency Response Performance Data” on
page 1-4.
System Dynamic Range Characteristics and Responsivity Measurement Range
The following table shows the maximum and minimum values of the O/E device under test (DUT)
frequency response.
Optical-to-Electrical Relative Frequency Response Versus ρ
Frequency Range r < 0.5 Specification ρ < 1.0 Specification
0.05 to 11 GHz ± 1.25 ± 2.35
11 to 20.05 GHz ± 1.70 ± 3.5
Optical-to-Electrical Measurement Performance Data
Description Frequency Range Characteristic
System Dynamic Range 0.05 to 0.84 GHz 77 dB
0.84 to 20.05 GHz 100 dB
Responsivity Measurement Range
a
a. Pertains to a 10 Hz IF bandwidth.
0.05 to 0.84 GHz Maximum Value
+43 dBe (A/W)
Minimum Value
–34 dBe (A/W)
0.84 to 20.05 GHz Maximum Value
+43 dBe (A/W)
Minimum Value
–57 dBe (A/W)