
Manual

Methods
Eppendorf BioSpectrometer
®
kinetic
English (EN)
50
6.4.5 Process results
The sample measurement is followed by two optional steps in the method sequence: process results and
print & export.
In the process results step, you can postprocess the results for some methods. Example: Changing the
spectra section of a scan.
As for the result display, you can navigate between the sample results of the measurement series with the
and cursor keys and select results for postprocessing.
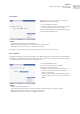
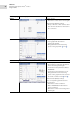
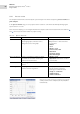
Tab. 6-3: Options: Overview
Option Explanation Available in methods
Zoom Change the axis limit of the absorbance
wavelength graph to limit the view to
enlarged sections of the graph.
Generally, all methods for which the
Scan parameter is offered and has
been activated.
• Multi λ
• Scan
• Nucleic acids
• Proteins direct UV
• Dye labels
• Bacterial density
• Dual wavelength
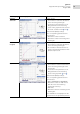
More calculations Convert concentration results into molar
concentrations and (after entering the
volume) into total amounts.
• Nucleic acids
• Dye labels (with nucleic acids as
biomolecule)
Peak detection Identifying peaks in absorbance wavelength
spectra.
• Scan
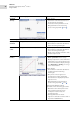
Linear regression Modifying time windows for the evaluation of
a kinetic via linear regression.
In principle, all kinetics methods for
which the "Linear regression"
measuring procedure was used.
• Single λ - continuous
• Simple kinetics
• Advanced kinetics
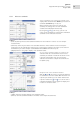
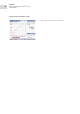
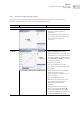
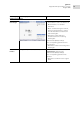
Options for postprocessing are presented on the two
softkeys at left. In this example: [Zoom] and [More
Calculations].