
Manual

45
Methods
Eppendorf BioSpectrometer
®
kinetic
English (EN)
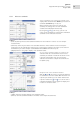
6.4.4 Measure samples: Results displays
This section contains a display of typical results displays for all method groups and an overview of
additional results data, which can be accessed using the [Data] softkey.
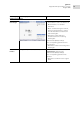
Method group Results display Explanation
Absorbance main group
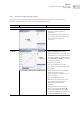
Single λ Results display:
• Absorbance at the measuring
wavelength
• Only for dilution or with cuvettes other
than 10 mm: additional display of the
absorbance value before the
conversion.
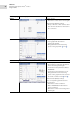
Single λ -
continuous
Prior to measurement:
• Check parameters method step:
Display temperature control. When the
temperature set in the parameters has
been reached and the display changes
from Tempering to Ready, you can go
to the measurement.
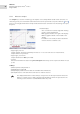
During the measurement:
• You can prematurely cancel the
measurement using the [Stop] softkey.
Results display:
• Graph with absorbance time display
and plotted regression line.
• Value for "A/min" calculated from the
linear regression.
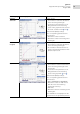
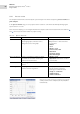
Additional data ([Data] softkey):
• Absorbance time value pairs for the
first and last measuring points.
• Quality parameters for linear
regression
• Navigate between the measuring
points in the graph with and .
• If necessary, change the time frame
for evaluation with linear regression in
the process results method step.