
Standalone VGA Grid User's Guide


Standalone VGA Grid User Guide
Streaming, recording and monitoring using the
Dashboard interface
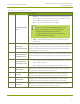
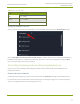
Table 7 Elements in the Dashboard interface
Number Title Description
1
Dashboard header
icons
l Warning – This icon displays only if there are any configuration
errors in your channels, sources, streams or recordings. Clicking
the icon displays more detail about the errors.
l Save – Saves any Dashboard layout changes.
Note that you need to press Save to preserve your
layout setting. When a layout is saved, all other
operators and administrators will see your
configured Dashboard layout when they log in or
refresh their Epiphan Live page.
l Menu – When clicked, displays links to the Switcher view and
Admin panel.
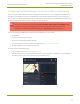
2
Dashboard
monitoring panels
Configurable panels used for confidence monitoring. You can set each
panel to display a source, channel, output or basic system information.
Note that the Dashboard monitoring panels appears blank by default
when logging in for the first time.
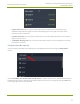
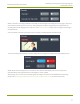
3
Dashboard panel
navigation icons
Click to navigate between three different sets of Dashboard monitoring
panels. The illuminated icon represents your currently displayed panel
set.
4
Dashboard panel
set quantity icons
l 2x – Changes the quanity of Dashboard panels per set to 2 (as in
the screen shot above).
l 4x – Changes the quantity of Dashboard panels per set to 4.
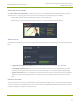
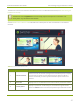
5 Video inputs
Displays a list of your video inputs configured in the Admin panel and
includes basic status information for each input.
6 Channels
Displays a list of your channels configured in the Admin panel and
includes streaming and recording control buttons for each channel.
7 Audio inputs
Displays a list of your audio inputs configured in the Admin panel.
Includes basic status information and a VU meter for each input.
8 Recorders
Displays a list of your recorders configured in the Admin panel and
includes a recording control button for each recorder.
31