
- Enterasys NetSight Element Manager IRM2 User's Guide


Statistics
3-8 Summary Statistics
• Percent Errors –– errors detected, as a percentage of total packets
• Percent Collisions –– collisions detected, as a percentage of total packets
The dynamic bar graphs allow you to immediately observe the amount of activity
experienced by each board or port; the scale displayed at the top right of the
window indicates the percentage of activity represented by the bar.
Accessing the Summary Statistics Windows
To access the device-level Summary Statistics window:
1. Click on R
epeater on the Chassis View menu bar to display the repeater
menu.
2. Drag down to Su
mmary Statistics... and release. The Repeater Summary
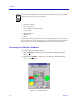
Statistics window, Figure 3-4, will appear.
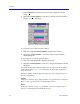
Figure 3-4. Device-level Summary Statistics Window
The device-level Summary Statistics window has three fields:
• The name assigned to each board (the number of the board indicates its
position in the MMAC). The Summary Statistics window will always display
8 available slots; any slots not occupied by a board will remain empty.
• The type of board, such as FOT or THN.
• The Percent Load, Percent Errors, or Percent Collisions (indicated by the scale
above the bar graph).
To open the board-level Summary Statistics window:
1. Click on the appropriate Board number in the Chassis View window to
display the board menu.