
- Enterasys NetSight Element Manager IRM2 User's Guide


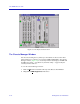

The IRM2 Chassis View
2-6 Viewing Chassis Information
• I/F Summary, which displays a window showing statistics for the traffic
processed by each network interface on your device. Refer to Viewing I/F
Summary Information, page 2-18.
• Ex
it, which closes the IRM2 Chassis View window.
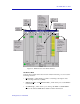
The View Menu
The View menu lets you change the information displayed in the Chassis View:
• L
ogical brings up the default display, which contains port status information
and provides access to board- and port-level menus.
• P
hysical provides a graphic representation of the actual module faces,
showing how ports are arranged on the MIM face and what connector types
are present.
• R
edundancy brings up a window that allows you to configure a redundancy
scheme for the IRM2 and its associated modules. See Chapter 7, Redundancy,
for further information.
The Port Status Menu
The Port Status menu allows you to select the status information that will be
displayed in the port text boxes in the logical Chassis View window:
• L
oad will display the portion of network load processed by each port as a
percentage of the theoretical maximum load (10Mbits/sec) of an Ethernet
network.
• Port T
ype will display each port’s topology: Station (STA) or Trunk (TRK).
• S
tatus allows you to select one of three status type displays: Admin/Link,
Admin, or Link.
• E
rrors allows you to display the percentage per port of the specific Error type
you select.
For more information on the port display options available via this menu, see
Selecting a Port Status View, in this chapter.
The Repeater Menu
This menu displays selections pertaining to the repeater network supported by
the IRM2. It has the following selections:
• Statistics..., which brings up the repeater-level Statistics windows; see
Chapter 3, Statistics, for more information.
• Timer Statistics..., which opens the repeater-level Timer Statistics windows;
see Chapter 3 for more information.
• Summary Statistics..., which accesses repeater-level statistics broken down by
individual board; see Chapter 3.
• Performance Graph..., which opens the Performance Graph windows; see
Chapter 3.