
- Enterasays User's Guide SmartSwitch 2000
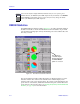
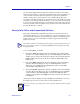
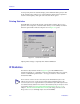
Table Of Contents
- Title Page
- Notice
- Contents
- Introduction
- The SmartSwitch 2000 Chassis View
- Viewing Chassis Information
- Using Device Find Source Address
- Managing the Hub
- Configuring Ports
- Redirecting Traffic on the SmartSwitch 2000
- Priority Configuration
- The System Resources Window
- 802.1Q VLANs
- Configuring Your 802.1Q VLANS
- Broadcast Suppression
- Setting the Device Date and Time
- Enabling and Disabling Ports
- Alarm Configuration
- Statistics
- Managing Ethernet MicroLAN Switches
- FDDI Applications
- ATM Configuration
- HSIM-W87 Configuration
- Index
Statistics
4-2 RMON Statistics
RMON Statistics
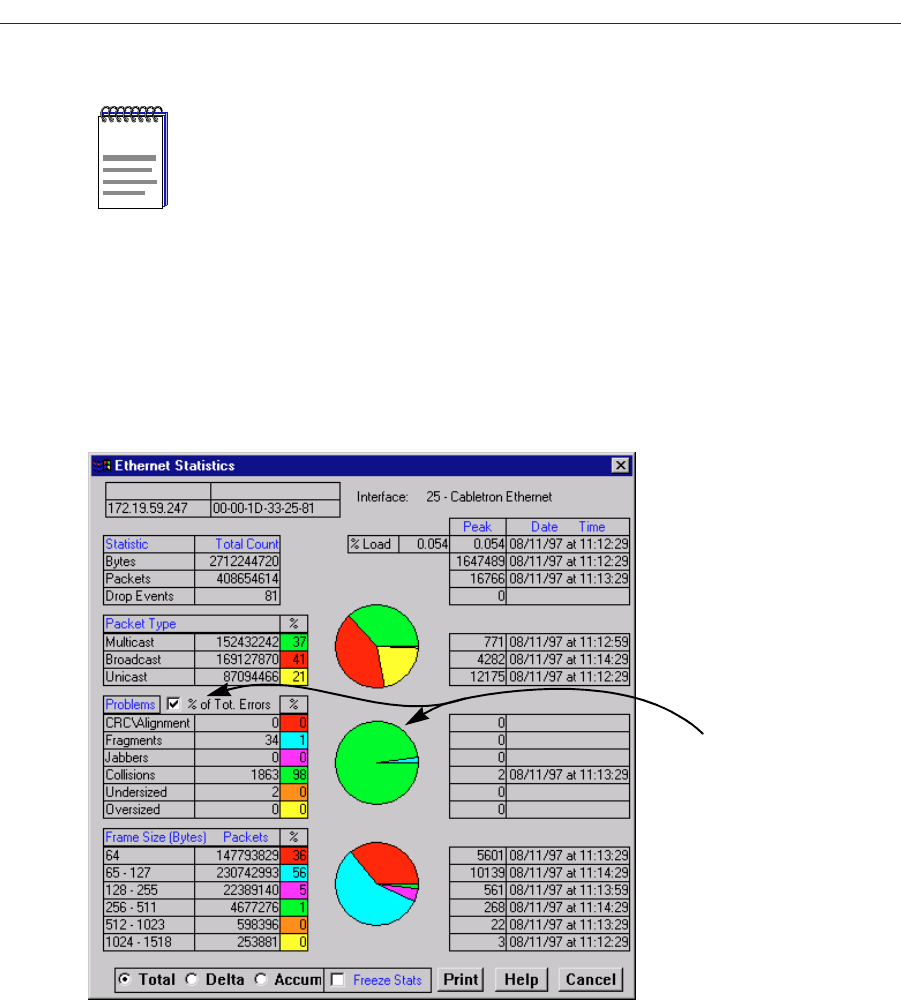
The RMON Ethernet Statistics window (Figure 4-1) provides a detailed statistical
breakdown of traffic on the monitored Ethernet network. Statistics are provided
in both numerical and graphic format, and include peak values and the date and
time they occurred.
Figure 4-1. The Ethernet Statistics Window
The selected interface number and its description are displayed at the top of the
Statistics window. The column on the left side of the window displays each
statistic’s name, total count, and percentage; the column on the right displays the
peak value for each statistic, and the date and time that peak occurred. Note that
peak values are always Delta values; see Viewing Total, Delta, and Accumulated
Statistics, on page 4-5, for more information.
NOTE
If the selected interface displays MIB-II I/F Statistics and you were expecting to see
RMON statistics, the RMON Default MIB component may be disabled; see the RMON
User’s Guide for information on how to check (and if necessary, change) the admin
status of the RMON Default MIB component.
The Errors pie
chart will only be
displayed when the
% of Tot. Errors
option is selected.