
Operating Instructions


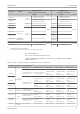


Table Of Contents
- Table of contents
- 1 About this document
- 2 Basic safety instructions
- 3 Incoming acceptance and product identification
- 4 Installation
- 5 Electrical connection
- 6 Operation options
- 7 System integration
- 8 Commissioning
- 9 Diagnostics and troubleshooting
- 10 Maintenance
- 11 Repair
- 12 Accessories
- 13 Technical data
- 14 Operating menu and parameter description

iTEMP TMT72 Technical data
Endress+Hauser 51
The measured error data correspond to 2 s (Gaussian distribution).
MV = Measured value
LRV = Lower range value of relevant sensor
Physical input measuring range of sensors
10 to 400 Ω Cu50, Cu100, polynomial RTD, Pt50, Pt100, Ni100, Ni120
10 to 2 000 Ω Pt200, Pt500, Pt1000
–20 to 100 mV Thermocouples type: A, B, C, D, E, J, K, L, N, R, S, T, U
Sensor adjustment Sensor transmitter matching
RTD sensors are one of the most linear temperature measuring elements. Nevertheless,
the output must be linearized. To significantly improve temperature measurement
accuracy, the device allows the use of two methods:
• Callendar-Van Dusen coefficients (Pt100 resistance thermometer)
The Callendar-Van Dusen equation is described as:
R
T
= R
0
[1+AT+BT²+C(T-100)T³]
The coefficients A, B and C are used to match the sensor (platinum) and transmitter in
order to improve the accuracy of the measuring system. The coefficients for a standard
sensor are specified in IEC 751. If no standard sensor is available or if greater accuracy is
required, the coefficients for each sensor can be determined specifically with the aid of
sensor calibration.
• Linearization for copper/nickel resistance thermometers (RTD)
The polynomial equation for copper/nickel is as follows:
R
T
= R
0
(1+AT+BT²)
The coefficients A and B are used for the linearization of nickel or copper resistance
thermometers (RTD). The exact values of the coefficients derive from the calibration
data and are specific to each sensor. The sensor-specific coefficients are then sent to the
transmitter.
Sensor transmitter matching using one of the methods explained above significantly
improves the temperature measurement accuracy of the entire system. This is because the
transmitter uses the specific data pertaining to the connected sensor to calculate the
measured temperature, instead of using the standardized sensor curve data.
1-point adjustment (offset)
Shifts the sensor value
Current output adjustment Correction of the 4 or 20 mA current output value.
Operating influences
The measured error data correspond to 2 s (Gaussian distribution).
Influence of ambient temperature and supply voltage on operation for resistance thermometers (RTD) and resistance
transmitters
Designation Standard
Ambient temperature:
Influence (±) per 1 °C (1.8 °F) change
Supply voltage:
Influence (±) per V change
Digital
1)
D/A
2)
Digital D/A
Maximum Based on measured value Maximum Based on measured value
Pt100 (1)
IEC
60751:2008
≤ 0.013 °C
(0.023 °F)
0.0013% * (MV - LRV),
at least 0.003 °C (0.005 °F)
0.003 %
≤ 0.007 °C
(0.013 °F)
0.0007% * (MV - LRV),
at least 0.003 °C (0.005 °F)
0.003 %