
User guide


21-100
OpenVera Native Testbench
Enabling the NTB Profiler
The VCS profiler has been enhanced to support NTB. The +prof
option enables the profiling of OpenVera NTB constructs and is used
in the vcs command line in conjunction with -ntb and other NTB
options when compiling the file. For example:
% vcs -ntb +prof other_ntb_compile_time_options \
verilog_files testbench_files
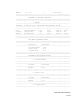
The NTB profile report is dumped in the vcs.prof log file.
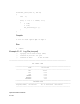
Performance Profiler Example
The NTB performance profiler is illustrated here by means of a
simple example. Program MyTest calls an OpenVera task MyPack,
and a DPI task DPI_call, together in a loop 20 times. The profiler
reports the relative portion of the runtime that each consumes.
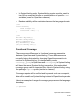
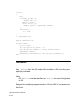
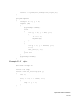
Example 21-10
#include <vera_defines.vrh>
// declare DPI tasks
import "DPI" function void DPI_call(integer a, integer b);
class A {
packed rand integer i;
}
task MyPack(integer k){
bit[31:0] arr[];
integer result, index, left,right;
A a = new;
a.i = k;
index = 0;
left = 0;
right = 0;
result = 0;