
User guide


12-19
Delays and Timing
In this example, by including the +pulse_on_detect option, VCS
causes the leading edge of the X value pulse on the output to begin
at time 11 because of an unusual event that occured on the output
between times 15 and 16 because of the rise at simulation time 11.
Using pulse on detect behavior can also show you when VCS has
scheduled multiple events for the same simulation time on the output
by starting the leading edge of an X value pulse on the output as soon
as VCS has scheduled the second event.
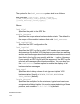
For example, a module that models a buffer has a rise time module
path delay of 10 time units and a fall time module path delay of 4 time
units. Figure 12-10 shows the waveforms for the input and output port
when you include the +pulse_on_detect option.
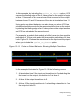
Figure 12-10 Pulse on Detect Behavior Showing Multiple Transitions
In the example illustrated in Figure 12-10 the following occurs:
1. At simulation time 0 the input port transitions to 0 scheduling the
first event on the output, a transition to 0 at time 4.
2. At time 4 the output transitions to 0.
3. At time 10 the input transitions to 1 scheduling a transition to 1 on
the output at time 20.