
User guide

4-16
Simulating Your Design
If there was CPU time used by a PLI application, you could use a tool
such as gprof or Quantify to profile the PLI application.
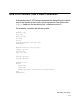
The Module View
This view shows you the module definitions whose instances use the
most CPU time. It does not list module definitions whose module
instances collectively use less than 0.5% of the CPU time.
Example 4-3 Module View
===========================================================================
MODULE VIEW
===========================================================================
Module(index) %Totaltime No of Instances Definition
---------------------------------------------------------------------------
FD2 (1) 62.17 10000 /u/design/
design.v:142.
EN (2) 8.73 1000 /u/design/
design.v:131.
---------------------------------------------------------------------------
In this example there are two module definitions whose instances
collectively used a significant amount of CPU time, modules FD2 and
EN.
The profile data for module FD2 is as follows:
• FD2 has an index number of 1. Other views that show the
hierarchical names of module instances use this index number.
The index number associates a module instance with a module
definition because module identifiers do not necessarily resemble
the hierarchal names of their instances.
• The instances of module FD2 used 62.17% of the CPU time.