
User guide

24-248
SystemVerilog Testbench Constructs
vcs -ntb -sverilog +dmprof dut_filename.v testbench_filename.sv \
[-debug | -debug_all]
Note:
Use the -sverilog compile-time option when compiling
SystemVerilog code.
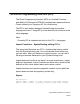
Runtime
At runtime, invoke $vcsmemprof() from the CLI command line
prompt as follows. You can make the call to $vcsmemprof() at any
point during the simulation:
simv -s //Invokes the cli prompt
cli_0>$vcsmemprof("memprof.txt", "w|a+")
The memory profiler reports the memory consumed by all the active
instances of the different dynamic data types. As noted above, the
memory profiler report is dumped in the filename specified in the
$vcsmemprof() call.
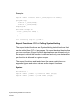
Incremental Profiling
Each invocation of $vcsmemprof() appends the profiler data to the
user specified file. The time at which the call is made is also reported.
This enables you to narrow down the search for any memory issue.
Only Active Memory Reported
The memory profiler reports only memory actively held at the current
simulation time instant by the dynamic data types.
Consider the following OpenVera program:
task t1() {