
User guide


8-14
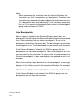
Interactive Window
Note:
When controlling the simulator from the Source Window, the
simulator runs until it encounters any breakpoint. Therefore, the
simulator may stop before the desired point for one of two reasons:
(1) a breakpoint was entered directly in the simulator command
line, or (2) an expression breakpoint was active in the breakpoint
group and evaluated as TRUE.
Line Breakpoints
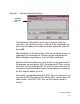
After a scope is loaded in the Source Window, green dots are
displayed in the left side of the Source Window to represent executed
lines. Each executed line can have a breakpoint. To set a line
breakpoint, click left on the green dot. The dot changes to red when
the breakpoint is set. The line breakpoint is permanent until removed.
If the Source Window is linked to the SIM link group, the line
breakpoints set simulator breakpoints. After all breakpoints are set,
you can continue the simulator. As soon as the simulator executes a
line with a breakpoint, it stops and displays the updated results in all
windows.
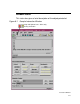
When the simulator stops because of a line breakpoint, a message
displays in the History area of the Interactive Window. For example:
Simulator stopped at line breakpoint: Line 12, Module top
If the Source Window is not linked to the SIM link group, the line
breakpoints do not stop the simulator.