
User guide

5-3
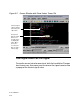
Source Window
Execution Pane
The Execution pane normally displays arrows to indicate statement
execution and dots to indicate line breakpoints (see
Table 5-1,
Statement Indicators in Execution Mode).
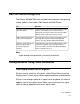
Table 5-1 Statement Indicators in Execution Mode
Indicator Description
In Post Simulation mode, small green dots represent
lines that have been executed at least once in the
simulation and where a breakpoint might be set. In
Interactive mode, the small dots indicate lines that may
potentially execute.
For a given simulation time, multiple arrows may be
displayed to indicate concurrent statement execution.
A single yellow arrow indicates the current statement
execution. In Post Simulation mode, only one current
statement per linked Source Window can execute at a
time. You can single step the arrow forward and
backward.
A red dot is displayed on lines where breakpoints have
been set. Pink dots indicate breakpoints se in other
instance groups. For VHDL, pink dots also indicate
breakpoints set from the command line of the
Interactive Window. To set or clear a breakpoint, left
click on the dot.
(Verilog only) An off-white outline arrow marks the
results of an Event Origin operation or indicates source
text that resulted from dragging and dropping any of
the following from the Logic Browser into the Source
Window:
• Assignment object
• Module instance object
• Primitive graphical object
A filled yellow arrow indicates the Event Origin or
source text is also the current execution file.