
Specifications


pdfcrowd.comopen in browser PRO version
Are you a developer? Try out the HTML to PDF API
After the measurements have been completed and the EQ calculated, the software gives you a number of tools to
tweak the results, as long as you are in advanced mode. Below is a comparison of standard and advanced modes.
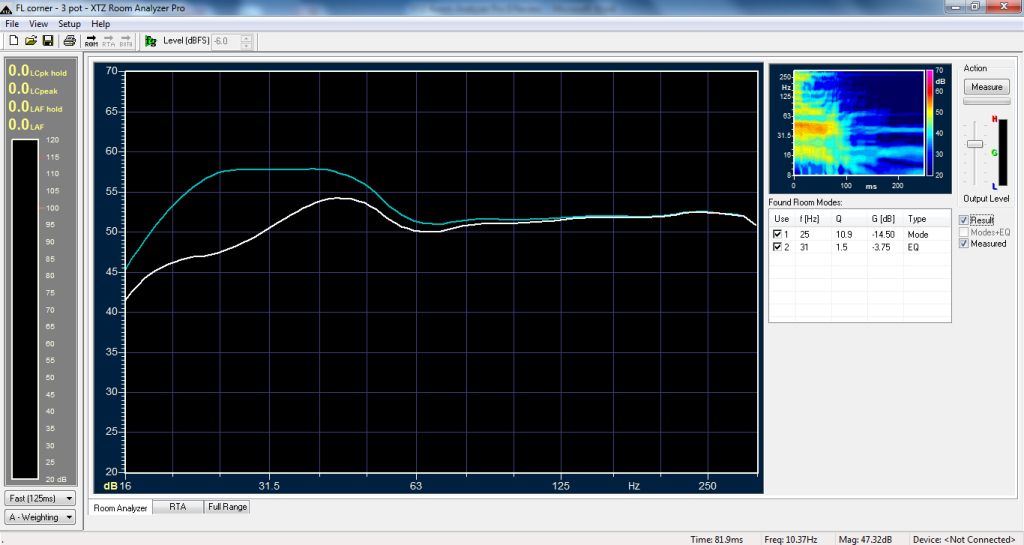
Room Analyzer Basic Mode
In the basic mode, you can view the measured curve (blue) and calculated results curve after applying the
suggested EQ (white). It also displays the found room modes with suggested EQ (frequency, gain, and Q) in the
table on the right. Above the table is a spectrogram that changes to show whatever curve you have selected. The
spectrogram and frequency response graphs can actually be swapped by double clicking whichever one is
displayed in the smaller window on the upper right.
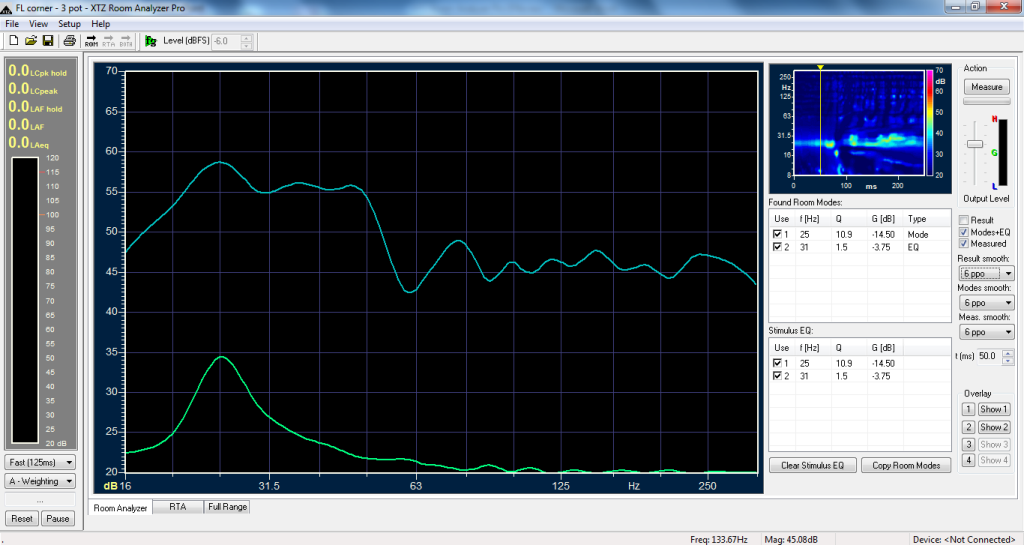
Room Analyzer Advanced Mode
As you can see by comparing the screenshots above, the advanced mode offers users much more control than the
standard mode. For starters, the time can be changed so you can view the frequency response at different decay
times. You can also now view a third curve, Modes + EQ (green), which helps visualize exactly what the filters are
doing. Maybe more useful than either of those features is the ability to copy Found Room Modes filters into a