
Network Router User Manual
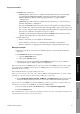
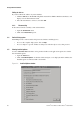
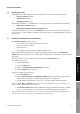
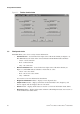
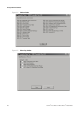

Table Of Contents
- Contents
- Before You Begin
- Installation and Setup
- 2.1 Overview
- 2.2 Installation and setup
- 2.2.1 Ensure required privileges
- 2.2.2 Install the ProLink II software
- 2.2.3 Generate the temporary license
- 2.2.4 Determine your connection type
- 2.2.5 Install the signal converter and connect the wires
- 2.2.6 Configure ProLink II connection parameters and connect to the transmitter
- 2.2.7 Obtain and configure a site key
- 2.3 Troubleshooting the ProLink II installation
- 2.4 Troubleshooting the ProLink II connection
- Using ProLink II Software
- Initial Transmitter Startup Procedures
- Transmitter Configuration, Characterization, and Calibration
- Meter Verification
- Data Logger
- Transmitter Terminal Reference
- Configuring the Discrete Batch Application
- Index
38 ProLink
®
II Software for Micro Motion
®
Transmitters
Using ProLink II Software
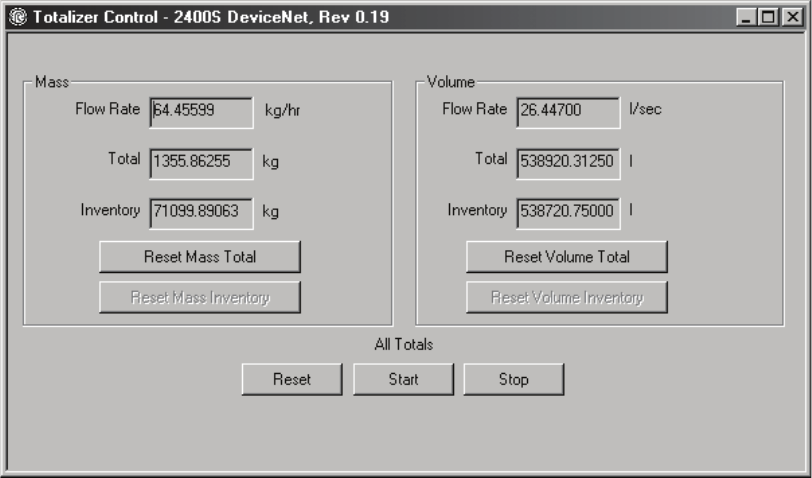
Figure 3-3 Totalizer Control window
3.8 Viewing meter status
ProLink II allows you to view a variety of status information:
•
Connection LED – located in the lower right corner of the main window (see Figure 3-1).
This LED indicates the status of the connection between ProLink II and the transmitter:
- Green – Good connection
- Red – Connection fault
- Gray – No connection
•
Device Fault Status LED – located in the lower right corner of the main window (see
Figure 3-1). This LED indicates whether or not alarms are active:
- Green – No active alarms
- Red – One or more active alarms
- Gray – Unknown
See Section 3.9 for more information about alarms.
•
Diagnostic Information window – displays sensor diagnostic data
•
Output Levels window – displays current data for the transmitter’s mA, frequency, and
discrete outputs, and also displays discrete event status
•
Status window – displays alarm status. See Section 3.9 for more information about alarms.
•
Alarm Log window – displays alarm status and alarm acknowledgment status. See Section 3.9
for more information about alarms.