Instruction Manual P/N MMI-20011276, Rev.
©2008, Micro Motion, Inc. All rights reserved. ELITE and ProLink are registered trademarks, and MVD and MVD Direct Connect are trademarks of Micro Motion, Inc., Boulder, Colorado. Micro Motion is a registered trade name of Micro Motion, Inc., Boulder, Colorado. The Micro Motion and Emerson logos are trademarks and service marks of Emerson Electric Co. All other trademarks are property of their respective owners.
Contents Chapter 1 Before You Begin . . . . . . . . . . . . . . . . . . . . . . . . . . . . . . . . . . . . . 1 1.1 1.2 1.3 1.4 Chapter 2 1 1 1 2 NOC Overview . . . . . . . . . . . . . . . . . . . . . . . . . . . . . . . . . . . . . . . 3 2.1 2.2 2.3 2.4 2.5 Chapter 3 About this manual . . . . . . . . . . . . . . . . . . . . . . . . . . . . . . . . . . . . . . . . . . . . . . . . . . . . Communication tools. . . . . . . . . . . . . . . . . . . . . . . . . . . . . . . . . . . . . . . . . . . . . . .
Contents Chapter 4 Configuring the NOC Application . . . . . . . . . . . . . . . . . . . . . . . . . 23 4.1 4.2 4.3 4.4 4.5 4.6 4.7 4.8 4.9 Chapter 5 23 23 24 29 29 29 30 30 30 30 31 31 32 36 Operation Mode – NOC . . . . . . . . . . . . . . . . . . . . . . . . . . . . . . . . 41 5.1 5.2 5.3 5.4 Chapter 6 About this chapter . . . . . . . . . . . . . . . . . . . . . . . . . . . . . . . . . . . . . . . . . . . . . . . . . . . Well Performance Measurement menu. . . . . . . . . . . . . . . . . . . . .
1.1 Before You Begin Chapter 1 Before You Begin About this manual This manual explains how to configure and use the Net Oil Computer application on the Micro Motion® Series 3000 MVD platform (a Model 3500 or Model 3700 MVD transmitter). 1.2 NOC Overview This manual does not provide information on basic installation, configuration, and use of the Model 3500 or Model 3700 transmitter.
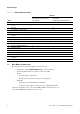
Before You Begin Table 1-1 Tasks and manual location Manual Series 3000 MVD Transmitters: Net Oil Computer Supplement (this manual) Step Series 3000 MVD Transmitters and Controllers: Configuration and Use Manual 1 Install the Series 3000 device ✓ 2 Wire the Series 3000 device to the sensor ✓ 3 Wire I/O ✓ 4 Set up digital communications ✓ 5 Start up the system ✓ 6 Learn to use the display and menu system ✓ 7 Configure security and language ✓ 8 Configure system data ✓ 9 Configure
2.1 Before You Begin Chapter 2 NOC Overview Overview This chapter discusses various topics that should be reviewed and considered before beginning configuration of the Series 3000 platform with the NOC application. Topics include: • - NOC system components – see Section 2.2.1 - Installation architecture – see Section 2.2.2 - Operation modes – see Section 2.2.3 - Water cut determination and required well data – see Section 2.2.5 NOC Overview • Introduction to the NOC system – see Section 2.
NOC Overview 2.2.1 NOC system components The Series 3000 MVD NOC system requires: • One Series 3000 MVD transmitter with the Net Oil Computer software option • One Micro Motion sensor installed on the oil/water or oil leg Optional components include: • A meter on the gas leg. This meter can be used for gas measurement with or without Transient Mist Remediation: - If only gas measurement will be implemented, either a third-party meter or a Micro Motion meter may be used.
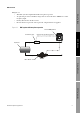
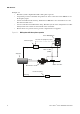
NOC Overview In Figure 2-1: The NOC system is implemented with a two-phase separator. • An optional gas meter is installed, and gas data is sent to the Series 3000 device via the frequency input. • Density-based water cut data is used. • Because there is no pressure sensor, pressure compensation is not applied.
NOC Overview In Figure 2-2: • The NOC system is implemented with a three-phase separator. • An optional gas meter is installed, and gas flow rate data is sent to the Series 3000 device via the frequency input. • A meter is installed on the water leg, but the Series 3000 device does not monitor or record flow data from this source. • A water cut monitor is installed on the oil leg. The NOC system can be configured to use either density-based water cut data or data from the water cut monitor.
NOC Overview In Figure 2-3: The NOC system is implemented with a Gas-Liquid Cylindrical Cyclone™ (GLCC). • A gas meter is installed on the gas leg. In this example, a Micro Motion meter is used, and it provides gas flow rate data for gas measurement, and drive gain data for Transient Mist Remediation via a HART connection. • Density-based water cut data is used. • A pressure sensor is installed on the oil/water leg. This enables pressure compensation.
NOC Overview 2.2.3 Operation modes The NOC system operates in either Well Test mode or Continuous mode: • In Well Test mode, well tests can be performed on up to 48 wells. A manifold system is used to ensure that output from a single well is routed through the test separator and the NOC system. See Figure 2-4. The system can save data for three tests per well. If more than three tests are run on a specific well, older tests are overwritten as required.
NOC Overview 2.2.4 Required well data • Density of dry oil from this well, at reference temperature and reference pressure. To ensure the most accurate net oil data, the density should be based on live oil rather than dead oil. “Live oil” refers to crude oil at line pressure. • Density of the water from this well, at reference temperature and reference pressure.
NOC Overview 2.3 NOC application features and options This section describes several features and options of the NOC application. 2.3.1 Temperature correction Temperature correction refers to the conversion of data collected at the observed process temperature to the equivalent values at reference temperature. The NOC application automatically applies temperature correction to NOC data, using the temperature data from the RTD built into the Micro Motion sensor. 2.3.
NOC Overview 2.3.3 Shrinkage factors Before You Begin “Shrinkage” is a decrease in volume caused by the evaporation of solution gas, by the flashing of volatile natural gas, or by lowered temperature during the crude oil stabilization process. By estimating the shrinkage during oil storage or transport, you can estimate sellable oil based on upstream volume measurement. The NOC application includes two shrinkage factors: one for oil and one for water.
NOC Overview To determine the value to use for the drive gain threshold, observe drive gain values for this system during various flow conditions.
NOC Overview Figure 2-8 Hold Last Value effect on density measurement Before You Begin Averaged retrieved density value Density (used in NOC calculations) Drive gain setpoint Drive gain (actual) NOC Overview 2.3.
NOC Overview When a transient mist interval is detected: • The mass flow rate over the previous n seconds is averaged and stored as the TMR M1 value, where n is the value configured for Time Period. • When the drive gain drops below the configured threshold for more than three seconds, the mass flow rate over the next n seconds is averaged and stored as the TMR M2 value. The M1 and M2 values are then averaged, and the resulting value M3 is used as the mass flow rate for the TMR interval.
NOC Overview Note the following: Only the most recent 24 hours of data can be recalculated. • Recalculation is based on 15-minute “snapshot” average values. As a result, recalculated data will typically be less accurate than the original data, which is based on continuous measurement. Before You Begin 2.4 • Planning the configuration This section contains a set of questions that you should answer before beginning basic configuration of the Net Oil Computer Software and the NOC system.
NOC Overview 2.5 NOC measurement terminology The terms used in NOC measurement are listed and defined in Table 2-1. These terms are used in a variety of process variables and locations throughout the NOC application. Table 2-1 NOC measurement terms and definitions NOC term Definition Gross The sum of the oil volume and the water volume, as measured by the NOC application. If TMR carry-over is implemented, this value includes oil and water from the gas leg.
3.1 Before You Begin Chapter 3 Using the Display and Menu System About this chapter This chapter explains how to use the Series 3000 display and menu system. Using the display, you can move through the menus, configure the application, monitor and control the application, and perform maintenance and diagnostic tasks: All NOC operations are accessed from the Well Performance Measurement screen. 3.
Using the Display and Menu System 3.3 Menu systems Most Series 3000 display functions are organized into two menu systems: • The Management menu allows you to perform configuration and maintenance tasks. • The View menu allows you to monitor and control the process. The Well Performance Measurement screens shown in Figure 3-1 are part of the View menu. Figures 3-2 and 3-3 show high-level views of these menu systems.
Using the Display and Menu System To enter the menus: To enter the Management menu system, press the Security button. The Security button is in the lower right corner of the display, marked with a padlock icon (see Figure 3-1). You may or may not be required to enter a password (see the following section). • To move from the Well Performance Measurement screen to the top-level View menu, press the EXIT button (see Figure 3-1). 3.3.
Using the Display and Menu System Figure 3-4 Function buttons ALARMS F3 function button DEVICE 1 Configuration Maintenance Security Language SEL HELP F1 function button EXIT F3 function button VIEW EXIT NO PREV ABORT Access the View menu Exit to previous menu or cancel a change Cancel action Return to the previous screen • Abort sensor zero • Abort calibration F2 function button HELP RESET START VIEW PRINT NEXT ACKALL Show a help screen Reset total Start a well test View net oil data Print a ti
Using the Display and Menu System 3.5 Using the cursor control buttons • Use the Up and Down buttons to locate the cursor at the menu item you want to select or change. • After locating the cursor at the desired menu item, press SEL or CHG, or the Right button, to select or change the item. 3.5.1 Before You Begin The cursor control buttons move the cursor around the display menus. In menus, the cursor is a reverse-video highlight bar.
Using the Display and Menu System Figure 3-5 Cursor control buttons EXIT Menu item Density Indicates items available to scroll Move cursor up/Scroll up ↓ Density Units g/cm3 Density Damping Current selection is highlighted SELECT 1.7 sec Density Cutoff 0.005000 g/cm3 Slug Low Limit 0.005000 g/cm3 CHG HELP Move cursor down/Scroll down EXIT Move cursor to left Variable Density ↓ Density Units Increase value at cursor or toggle YES/NO g/cm3 Density Damping 1.7 sec Density Cutoff 0.
4.1 Before You Begin Chapter 4 Configuring the NOC Application About this chapter This chapter explains how to configure the NOC application and perform density determination procedures. The following topics are discussed: Basic configuration procedure – see Section 4.3 • Setting up a water cut monitor – see Section 4.4 • Setting up pressure compensation – see Section 4.5 • Setting up Transient Bubble Remediation – see Section 4.6 • Setting up gas measurement – see Section 4.
Configuring the NOC Application Figure 4-1 Well Performance Measurement menu Well Performance Meas Mode of operation Continuous Mode Well Test Mode Reference Temperature 60 degF 15 degC 20 degC External inputs Gas Meter Gas Volume Units Water Cut Monitor Ext Water Cut Limit Compensations Transient Bubble Remd • Drive Gain Level • Action Taken • Time Period Transient Mist Remed(2) • Drive Gain Level • Time Period • Add Carry-Over Totals • Gas Meter HART Tag Press Comp Oil Dens Well Data-Densities
Configuring the NOC Application 4. If you are using Well Test mode: b. Assign a name to the well. c. Use the Well Data-Densities menu to set the well parameters for the well to be measured. See Table 4-1 for definitions of these parameters. d. Repeat for all wells in the system. Before You Begin a. Use the Well Data-Densities menu to specify the well to configure. Note: Micro Motion recommends configuring wells in the order in which they will be tested.
Configuring the NOC Application 7. Set the parameters in the Compensations menu as desired. • For Transient Bubble Remediation, see Section 2.3.4 for a discussion of this feature, and see Section 4.6 for additional setup instructions. • For Transient Mist Remediation, see Section 2.3.6 for a discussion of this feature, and see Section 4.8 for additional setup instructions. • For Pressure Compensated Density, see Section 2.3.2 for a discussion of this feature, and see Section 4.
Configuring the NOC Application Table 4-3 NOC status alarms Before You Begin 9. If desired, configure the severity level of the NOC status alarms. The status alarms listed in Table 4-3 indicate specific states of the NOC application. Like all other status alarms on the Series 3000 platform, they can be configured for three different severity levels – Ignore, Info, and Fault.
Configuring the NOC Application 10. If desired, configure the process monitor to display NOC process variables. Instructions for configuring the process monitor are in the manual entitled Series 3000 MVD Transmitters and Controllers: Configuration and Use Manual.
Configuring the NOC Application 4.4 Setting up a water cut monitor 1. Ensure that the water cut monitor is correctly installed and tested, and configured to report water cut data in %. 2. Enable the water cut monitor as an external input, as described in Section 4.3, Step 5. 3. If desired, specify a value for Ext Water Cut Limit. When the measured water cut exceeds this value, an alarm will be posted. Micro Motion recommends setting this parameter to the highest value in your water cut monitor’s range.
Configuring the NOC Application 4.5.2 Setting up pressure compensation for oil density and water density To set up pressure compensation for oil density and water density: 1. See Figure 4-1. In the Well Data-Densities menu, set Press Comp Oil Density to the factor to be used to compensate for the effect of pressure on oil density. 2. In the Compensations menu, set Press Comp Density to Enable. 4.5.
Configuring the NOC Application • In Continuous mode – set for the well to be measured • In Well Test mode – set for each well to be measured 6. To verify that gas data is being received, view the current gas volume as shown in Figure 5-1 (Well Test mode) or Figure 5-3 (Continuous mode). Ensure that the displayed value matches the value sent by the gas measurement device. 4.8 Before You Begin 5.
Configuring the NOC Application Figure 4-2 Density determination – Last Dates screen Density Determination Last Water Density xxxx Last Oil Density xxxx Continue? YES Figure 4-3 NO Density determination – Procedure Selection screen Density Determination Water Density Oil Density Enter Water Cut SEL 4.9.1 HELP EXIT Performing a density determination for water There are two density determination methods for water: in-line and manual.
Configuring the NOC Application In-line density determination for water 1. Ensure that the correct fluid (water) is flowing through the sensor. You may need to close the outlet valve from the separator and wait for the phases to settle, then open the outlet valve. 2. From the Calibration menu, select Density Determination and work through the screens until the Procedure Selection screen (see Figure 4-3) is displayed.
Configuring the NOC Application During this period, the screen shown in Figure 4-5 is displayed. (The current pressure value may or may not be displayed.) You can press STOP to stop the averaging. You will be returned to the previous screen. Figure 4-5 Density determination for water – In process --AVERAGING-Actual Water Density x.xxxx g/cm3 Actual Temperature xxx.x deg F Actual Pressure xx.xxxx PSI STOP 8. When the good sample is achieved, the results are shown on a screen similar to Figure 4-6.
Configuring the NOC Application • Press SAVE to save the current pressure value as the new reference pressure. • Press EXIT to retain the existing reference pressure. Manual density determination for water Before You Begin 9. If pressure compensation for oil density and water density is enabled, pressure data from the beginning of the density determination procedure is displayed, along with the stored reference pressure. To perform a manual density determination for water: 1.
Configuring the NOC Application 9. The NOC application converts the observed water density to water density at reference temperature, and displays a screen similar to Figure 4-8. This screen also displays the stored value for water density at reference temperature, and the date and time at which this value was stored. • To replace the stored value with the new value, press SAVE. • To discard the data from this procedure, press EXIT. You will be returned to the Procedure Selection screen.
Configuring the NOC Application Figure 4-9 Density determination for oil – Preparing to start Bottom of screen Oil Density Oil Density Actual Density x.xxxx g/cm3 Actual Temperature xxx.x degF Actual Pressure xx.xxxx PSI Volume x.xxx bbl Actual Rate START START RESET EXIT Before You Begin Top of screen xxx.x bbl/day Oil Deviation x.xxxx g/cm3 Oil Duration Ave xx sec RESET EXIT NOC Overview 4.
Configuring the NOC Application Figure 4-10 Density determination for oil – In process --AVERAGING-Actual Density x.xxxx g/cm3 Actual Temperature xxx.x deg F Actual Pressure xxx.xxx bbl/hr External Water Cut x.xxxx % STOP 7. If you are using the density-based water cut, take a sample of the fluid in the pipe during this averaging period, then measure the water cut of the sample. You can use any standard procedure (e.g., centrifuge, distillation, Karl-Fischer, etc.) to measure the water cut.
Configuring the NOC Application Figure 4-11 Density determination for oil – Interim results Before You Begin Measure and Save Average Oil Density x.xxxx g/cm3 Average Temperature xxx.x degF Volume x.x g/cm3 Actual Rate xxx.x bbl/day SAVE HELP EXIT • • Press SAVE to save this data for use in density determination. The reference density of dry oil from this density determination will then be computed and displayed, along with the current values.
Configuring the NOC Application Figure 4-12 Density determination for oil – Water cut entry screen Enter Water Cut Water Cut xx.xx % Apply to Sample Taken dd-mmm-yy hh:mm Calculate at Ref CHG EXIT 14. Enter the water cut measured in Step 7, then press SAVE. 15. Select Calculate at Ref, then press SEL. The NOC application uses this water cut data to convert the observed oil density to dry oil density at reference temperature, and displays a screen similar to Figure 4-13.
5.1 NOC Operation Chapter 5 Operation Mode – NOC About this chapter This chapter explains how to use the NOC application to run a well test or perform continuous measurement. The following topics are discussed: • - Well testing overview – see Section 5.2 - Running a well test – see Section 5.2.1 - Viewing well test data – see Section 5.2.2 - Time periods for average, minimum, maximum, and total values – see Section 5.2.3 - Other activity during a well test – see Section 5.2.
Operation Mode – NOC Figure 5-1 Well Performance Measurement menu – Selecting the well View menu EXIT Well Performance Meas Start Well Test Well Selection screens Well Selection screens Wells 1 to 12 Wells 13 to 24 Wells 25 to 36 Wells 37 to 48 Wells 1 to 12 Wells 13 to 24 Wells 25 to 36 Wells 37 to 48 Well #: Well name Well #: Well name Well #: Well name Well #: Well name ... Well #: Well name Well #: Well name Well #: Well name Well #: Well name ...
Operation Mode – NOC Figure 5-2 Well Performance Measurement menu – Running the well test NOC Operation from Well Selection screens Well name Last Test Time Date START On Test Test Started Date Time Test Time Elapsed Hour Min Troubleshooting STOP EXIT VIEW Stop Well Test? NO Return to Well Test View Well Tests View Current Test Recalculate Well Test Actual Net Oil Rate Average Net Oil Rate Actual Water Cut Average Water Cut Actual Gross Rate Average Gross Rate Actual Density Actual Temperature Ac
Operation Mode – NOC 5.2.1 Running a well test To run a well test: 1. Ensure that the NOC application is set for Well Test mode, and that all necessary data for the well has been configured. 2. As shown in Figure 5-1: a. From the View menu, select Well Performance Measurement. b. Select Start Well Test. c. Navigate to the well to be tested. 3. As shown in Figure 5-2: a. Press START. The well test screen is displayed, showing the test start time and the elapsed time. b.
Operation Mode – NOC 5.2.2 Viewing well test data Note: You can also read well test data via Modbus or report actual and average process variables by assigning them to a milliamp or frequency output. To access basic data for the current well test, press View from the On Test screen (see Figure 5-2). The values listed in Table 5-2 are displayed. Table 5-1 NOC Operation You can access well test data at several points in the menu.
Operation Mode – NOC Table 5-2 Quick View data – Well Test mode Process variable Definition Average net oil rate Current net oil flow rate. May or may not include oil carry-over, depending on TMR configuration. Net oil total Total net oil, by volume, calculated from the beginning of the well test. May or may not include oil carry-over, depending on TMR configuration. Average water cut Average water cut value, calculated from the beginning of the well test.
Operation Mode – NOC Table 5-3 Production data – Well Test mode continued NOC Operation Values Process variable Actual Avg Min Min time / date Max Max time / date Total Test times Test started Timestamp Test time elapsed Hours and minutes Transient bubble time Hours and minutes Water cut overrange Hours and minutes Transient mist time Hours and minutes Table 5-4 TMR data – Well Test mode Definition Mass flow rate Current mass flow rate from the gas meter 2-phase mass total Total ma
Operation Mode – NOC 5.2.5 Recalculating well test data You can recalculate well test data for any stored well test. You can perform the recalculation during a well test or between well tests. To recalculate well test data: 1. Refer to Figure 5-2 and select Recalculate Well Test. 2. Navigate to the well test you want to recalculate. 3. Select Recalc Parameters and set recalculation values as desired. See Table 5-9. You can set one, several, or all of the recalculation values.
Operation Mode – NOC Table 5-5 Recalculation parameters – Well Test mode Configurable? Definition Original Ref Temp No Reference temperature for NOC calculations applied during data collection Recalc Reference Temp Yes Reference temperature to used for recalculation Orig Water Density(1) No Reference density of water from this well applied during data collection Recalc Water Density Yes Reference density of water to be used for recalculation No Reference density of oil from this well applie
Operation Mode – NOC Figure 5-3 Well Performance Measurement menu – Continuous mode measurement View menu EXIT Well Performance Meas View Production Meas Quick View Pause / Resume Net Oil Water Cut Gross Flow Net Water Drive Gain Density Temperature Back Flow Mass Flow Gas Volume(1) TMR Flow(2) TMR Drive Gain(2) Uncorrected Flow Average Net Oil Rate Net Oil Total Average Water Cut Average Gross Rate Gross Total Average/Total Since Test Time Elapsed Transient Bubble Time Water Cut Overrange(3) Total
Operation Mode – NOC 5.3.1 Viewing Continuous mode measurement data NOC Operation To view basic data from Continuous mode measurement, use the Quick View menu shown in Figure 5-3. Process variables available from the Quick View menu are listed in Table 5-6. Note: You can also read Continuous mode measurement data via Modbus or report actual and average process variables by assigning them to a milliamp or frequency output.
Operation Mode – NOC Table 5-7 Production data accessible via View Production Measurement screen – Continuous mode Values Process variable Actual Avg Min Min time/ date Max Max time/ date Total Y Reset time/ date Inventory Net oil Y Y Y Y Y Y Water cut Y Y Y Y Y Y Y Y Gross flow Y Y Y Y Y Y Y Y Y Net water Y Y Y Y Y Y Y Y Y Drive gain Y Y Y Y Y Density Y Y Y Y Y Y Y Temperature Y Y Y Y Y Y Y Back flow Y Y Y Y Y Y Y Y Y Y Mass
Operation Mode – NOC 5.3.3 Resetting, saving, and managing Continuous mode time periods Note: Inventory values are calculated from the beginning of continuous mode measurement until reset by digital communications (Modbus coil 4 or HART command 242). You can reset the start time for these running calculations: • NOC Operation Running average, minimum, maximum, and total values are calculated from the beginning of Continuous mode measurement.
Operation Mode – NOC 5.3.4 Other activity during Continuous mode measurement During continuous measurement, you can use the EXIT button on the Well Performance Measurement screen to move between the continuous measurement screens and the View menu. From the View menu, you can perform any available actions. At any point from the continuous measurement screens, you can press the Security button to access the Configuration and Maintenance menus.
Operation Mode – NOC Figure 5-5 Archive records – Continuous mode measurement NOC Operation View menu EXIT Well Performance Meas View Archives Recalculate Timestamp Timestamp Timestamp Timestamp REC(1) Timestamp Timestamp Timestamp Perform Recalculation View Recalc Data Net Oil Water Cut Gross Flow Net Water Drive Gain Density Temperature Back Flow Mass Flow Gas Volume Uncorrected Flow Series 3000 Menus Recalc Parameters Original Ref Temp Recalc Reference Temp Orig Water Density Recalc Water Den
Operation Mode – NOC 5.3.6 Recalculating Continuous mode data To recalculate Continuous mode data, refer to Figure 5-5 and: 1. Select Recalculate from the Well Performance Measurement menu. 2. Specify the archive record you want to recalculate. 3. Select Recalc Parameters and set recalculation values as desired. See Table 5-9. You can set one, several, or all of the recalculation values. If you do not assign a new value, the original value is used during recalculation.
Operation Mode – NOC Table 5-9 Recalculation parameters – Continuous mode measurement (1) Original Ref Temp Configurable? Definition No Reference temperature for NOC calculations applied during data collection Recalc Reference Temp Yes Reference temperature to used for recalculation Orig Water Density(1) No Reference density of water applied during data collection Recalc Water Density Yes Reference density of water to be used for recalculation No Reference density of oil applied during da
58 Micro Motion® Series 3000 MVD Transmitters
6.1 NOC Operation Chapter 6 Diagnostics and Troubleshooting About this chapter This chapter provides information on the status alarms associated with the NOC application. Note: For information on diagnostics or troubleshooting for the Series 3000 platform, see the manual entitled Series 3000 MVD Transmitters and Controllers: Configuration and Use Manual. NOC status alarms Table 6-1 lists all status alarms associated with the NOC application, with descriptions and suggested user actions.
60 Micro Motion® Series 3000 MVD Transmitters
A.1 NOC Operation Appendix A Series 3000 Menu Flowcharts Overview This appendix provides menu flowcharts for the Series 3000 display when the NOC application is installed: Startup display – see Figure A-1 • View menu – see Figure A-2 • Management menu, top level – see Figure A-3 • Configuration menu – see Figures A-4 through A-7 • Maintenance menu – see Figure A-8 Troubleshooting A.
Series 3000 Menu Flowcharts A.3 View menu Figure A-2 shows the View menu.
Series 3000 Menu Flowcharts A.4 Management menus Figure A-3 • Figure A-3 shows the top level of the Management menu, plus the Security and Language menus. • Figures A-4 through A-7 show the Configuration menu. Note that the Digital Communication menu structure changes according to the setting of the Protocol parameter. • Figure A-8 shows the Maintenance menu.
Series 3000 Menu Flowcharts Figure A-4 Configuration menu Management Menu Configuration continued System · · · · Tag Time Date Alarm Severity · Electronics Alarms · Process Alarms · Sensor Alarms · Configuration Alarms Config Process Var · Flow Variables · Flow Damping · Flow Direction · Mass Units · Mass Low Flow Cutoff · Volume Flow Type · Volume Units · Vol Low Flow Cutoff · Special Mass Units · Special Volume Units · Density · Density Units · Density Damping · Density Cutoff · Slug Low Limit · Slu
Series 3000 Menu Flowcharts Figure A-5 Configuration menu continued NOC Operation Management Menu Configuration continued Well Performance Measurement Mode of Operation Reference Temperature Compensations Gas Meter Gas Volume Units Water Cut Monitor External Water Cut Limit Transient Bubble Remd · Drive Gain Level · Action Taken · Time Period Transient Mist Remd(2) · Drive Gain Level · Time Period · Add Carry-Over Totals · Gas Meter HART Tag Press Comp Oil Dens Well #: Well Name(1) Well #: Well Na
Series 3000 Menu Flowcharts Figure A-6 Configuration menu continued Management Menu Configuration continued Measurements Monitoring Screens 1–5 · Variables 1–4 Discrete Events · Discrete Event 1–5 · Event Type · Process Variable · HI PV Value(1) · LO PV Value(1) Variables · Number of Decimals Update Period Outputs Discrete Outputs · Discrete Output 1–3 · Polarity · Assignment · Fault Indication · Flow Switch Source(2) · Flow Switch Setpoint(2) (1) (2) (3) (4) 66 Milliamp Outputs · Milliamp Output
Series 3000 Menu Flowcharts Figure A-7 Configuration menu continued NOC Operation Management Menu Configuration Digital Communication Protocol=HART, Modbus RTU, Modbus ASCII Device Setup · Fault Setting · Description · User Message · HART QV · HART Device ID · Transmitter Serial No Configure RS-485 · Protocol · HART · Modbus RTU · Modbus ASCII · Printer · Configure Protocol · Baud Rate · Parity · Data Bits · Stop Bits · Polling Address · Byte Order Configure RS-485 · Protocol (Printer) · Configure
Series 3000 Menu Flowcharts Figure A-8 Maintenance menu Management Menu Maintenance Active Alarm Log Alarm History Alarm Event Log Process Inventory Mass Inventory Volume Inventory Freq Input Inventory Meter Verification(3) Calibration Sensor Zero · Zero Time · Mass Flow Rate · Calibrate Zero · Restore Factory Zero · View Current Data Density · Low Density · Density · D1 · Calibrate Density · High Density · Density · D2 · Calibrate Density · Flowing Density · View Current Data mA Output Trim · Mill
Index B Buttons cursor control buttons 21 function buttons 19 Security button 19 E External water cut See Water cut, from water cut monitor F Function buttons 19 G Gas carry-under See TBR Gas measurement configuration 25, 30 overview 13 TMR option 13 Gas meter 4 Gas reference density 25 Gas-Liquid Cylindrical Cyclone See GLCC GLCC 7 Series 3000 Menus I Installation steps 1 L Liquid carry-over See TMR Index Net Oil Computer Supplement D Density-based water cut See Water cut, density-based Display scie
Index M Management menu 18 Security button 19 Manuals 1 Menu system flowcharts 61 Management menu 18 Management menu flowcharts 63 shortcuts 19 using 17 View menu 18 View menu flowcharts 62 Well Performance Measurement menu (Configuration) 23 Well Performance Measurement menu (Configuration) flowcharts 24 Well Performance Measurement menu (View) Continuous mode 50, 55 Well Test mode 42, 43 Well Performance Measurement menu (View) flowcharts 50 Continuous mode 50, 55 Well Test mode 43 42 Micro Motion custom
Index NOC Operation T TBR configuration 26, 30 overview 11 Temperature correction 10 Terminology 16 TMR configuration 26, 31 overview 13 Transient Bubble Remediation See TBR Transient Mist Remediation See TMR Troubleshooting 59 customer service telephone number 2 Troubleshooting V View menu 18 Series 3000 Menus W Water cut 9 density-based 9 determination options 9 external water cut 9 from water cut monitor 9 Water cut monitor 4, 9 configuration 25, 29 Water deviation 25 Water duration ave 25 Well nam
72 Micro Motion® Series 3000 MVD Transmitters
© 2008, Micro Motion, Inc. All rights reserved. P/N MMI-20011276, Rev. A *MMI-20011276* For the latest Micro Motion product specifications, view the PRODUCTS section of our web site at www.micromotion.com Micro Motion Inc.