
Brochure


Fisher
®
Cavitation-Control Technologies | 7
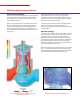
Process Loop Design
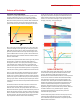
Flow conditions that will produce damaging cavitation can
often be avoided at the design phase of a project by giving
proper consideration to service conditions and the process
loop design. Process loop design can influence cavitation in a
control valve. Figure 1 shows a valve installation and pressure
plot where the majority of the pipe system is upstream of
the valve. Looking at the pressure along the pipe or loop, the
valve is positioned where P
2
is close to P
v
and the likelihood of
cavitation in the control valve is high.
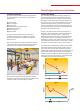
In Figure 2, the valve has been relocated so the majority of
the system is downstream. Now P
2
associated with the valve
is higher and thus much different from P
v
, therefore the
likelihood of cavitation is much lower. This demonstrates the
value of locating the valve to leverage the natural pressure
distribution in a system. These simple diagrams show only pipe
but the effect of all system elements—such as reactors, vessels,
and pumps—must be considered in a loop pressure review.
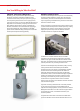
If valve placement is not flexible, flow resistance can be added
downstream of the control valve utilizing an orifice plate or a
second valve. Fluid pressures within the valve increase and it
will experience less pressure drop. However, this technique may
simply displace cavitation from the valve to the downstream
restriction and may not effectively control the cavitation in the
system. This may also increase valve size, as less pressure drop
is available to process the same amount of flow.
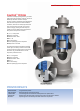
Cavitation Coefficient
The Fisher cavitation coefficient indicates the potential for
damaging cavitation in a control valve. It is dependent on
several factors:
n Valve/trim style
n Service conditions
n Fluid properties
n Intensity/magnitude of pressure drop
n Materials of construction
n Length of exposure
n Quantity of flow
The Fisher cavitation coefficient predicts the onset of
cavitation-related damage. It is available for every Fisher
cavitation-control product throughout its full, intended
application range.
Other vendors utilize similar application guidelines. The user
is cautioned to always use the guideline associated with the
chosen vendor. The coefficient is not interchangeable.
Plant Designs that Prevent Cavitation
PRESSURE
P
V
P
1
P
VC
P
2
PRESSURE
P
1
P
2
P
V
P
VC
Figure
1
Figure 2
Predicting the onset of damaging cavitation is an arduous task.
Emerson Process Management’s field experience, research
capabilities, and subject matter expertise in fluid behavior help
improve the ability to predict damaging cavitation.