
Brochure


Variability
Variability is the statistical difference
between the process variable and
process set point. In a perfect world
these points would always coincide,
however we know this rarely hap-
pens and there will always be a
degree of variability.
Generally the greater the variability
present the further the set point
needs to be from the optimum level.
This is so that there is less risk of the
loop operating outside of safe or eco-
nomically desirable parameters.
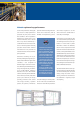
Often the level of variability can be
hidden from the operators because of
filtering, or averaging within the DCS.
Even if the level of variability is hidden
the symptoms can still be seen.
The symptoms and effects of high lev-
els of variability can be seen at the
business level with increased raw
material costs, higher than expected
energy usage, lower output, reduced
operating equipment effectiveness
(OEE) and product quality issues. At
the operating level variability can
cause oscillations leading to process
alarms or plant trips, reduced plant
capacity and the need to slow the
process down or switch to manual
operation.
Variability has many causes that can
originate from poor process or plant
design, poor control strategy or tun-
ing or badly selected and maintained
instruments and control valves.
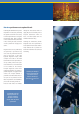
Independent audit findings show that
as much as 40% of all variability is
caused by the control valve. This may
be due to reduced maintenance activ-
ities or to incorrect sizing and selec-
tion.
Variability often cannot
be seen, but the symp-
toms can; including
product quality issues,
plant trips, process
alarms and reduced
capacity.