
Wireless Office Headset User Manual


EMBARCADERO TECHNOLOGIES > DSAUDITOR 4.5 USER GUIDE 8
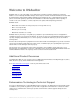
Dashboard Charts
View Charts
DSAuditor includes 29 “dashboard” charts for commonly required performance-, privacy-, and security-related auditing
tasks.
NOTE: Several shared filters must be modified before these charts will be accurate and useful. For
details, see Modify Default FIlters Used by Charts
.
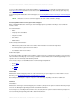
To view a chart, hover the mouse pointer over Security, Privacy, or Performance in the top menu, then select a
category from the submenu:
The Refreshed field at the top of the report indicates the last time the report was updated. To update again, click the
Refresh icon in the upper-right corner. If the chart is blank, there may be no data within the selected date range.
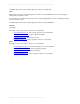
To see the SQL query that generates the chart, click the sql icon in the upper-right corner.
Top Menu Submenu Chart (click for description)
Performance Column Usage Top 25 Column Accesses, Top 25 Column Updates
Dormant Objects Dormant Columns, Dormant Tables
Long Running Top 25 Largest Data Returns, Top 25 Longest Running Queries
Table Joins Table Join Summary - Month-to-Date, Table Join Summary - Last Year,
Month-to-Date
Table Usage Table Accesses, Table Updates
Privacy Non-Privileged Users Failed Selects by Non-Privileged Users, Large Selects by Non-Privileged Users,
Non-Privileged Select Activity Total
, Non-Privileged Select by Table, Select
Activity by Non-Privileged Users
Privileged Users Failed Selects by Privileged Users, Large Selects by Privileged Users, Select
Activity by Privileged Users
Security Data Changes Data Changes by Privileged Users, Data Changes by Unauthorized Applications
Logins Login Source Information, Non-Privileged Normal Business Hour Logins,
Non-Privileged Off-Hour Logins
, Privileged Normal Business Hour Logins,
Privileged Off-Hour Logins
Permissions Grant-Revoke Activity, Role and User Account Activity
Schema Changes Database Schema Change Summary, Schema Changes by Unauthorized
Applications