
Technical data

33
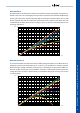
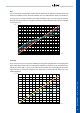
EQ Frequency
This diagram shows a variation of center frequencies with the EQ Gain controller fully turned clock-
wise (HI). The x10 button shifts the complete frequency area by a factor of 10. With settings in the
border areas of the covered frequencies it is also possible to realize “almost” shelving lters, but in
these cases the level has to be adapted with the Gain controllers.
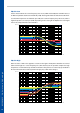
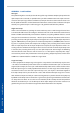
SC Gain
The blue curve shows an almost linear compression with a constant Gain reduction across the
complete frequency spectrum. If the SC Gain controller is set to High Pass (HP – green curve),
however, the low frequencies will not inuence the detection circuit and the Gain reduction sets in
only on higher frequencies. In Low Pass mode (LP – yellow curve) just the low frequencies are fully
processed and the intensity of the Gain reduction decreases with rising frequencies. Of course
there are a lot of useful interim values between the linear and the extreme positions.
-10
+10
-9
-8
-7
-6
-5
-4
-3
-2
-1
-0
+1
+2
+3
+4
+5
+6
+7
+8
+9
20 30k50 100 200 500 1k 2k 5k 10k 20k
Hz
dBr A
-10
+10
-9
-8
-7
-6
-5
-4
-3
-2
-1
-0
+1
+2
+3
+4
+5
+6
+7
+8
+9
20 30k50 100 200 500 1k 2k 5k 10k 20k
Hz
dBr A
REFERENCE - EQ Frequency & SC Gain