
User's Manual

Elpro Technologies 450U-E Wireless Ethernet Modem & Device Server User Manual
Rev Version 1.0.12-Beta7 www.cooperbussmann.com/wirelessresources 57
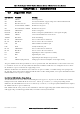
The Statistics webpage is used for advanced debugging of 450U-E. This webpage details the state of the 450U-E and
performance information. This page is typically useful to ELPRO technical support personnel in diagnosing problems with
the module.
Note: When updating the Connectivity webpage, it is necessary to hold down the <ctrl> key while
pressing the refresh button to ensure the most up to date information is displayed.
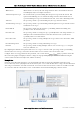
The Statistics Page is used for gathering information about how the module is connected and communicating. It is
comprised of a number of dynamic list boxes with each showing particular statistics about its function.
Interface Statistics: will show the number of bytes transmitted and received as well as the number of CRC errors,
dropped packets, fifo alarms and the different types of frames (fragmented, compressed or multicast).
communicating.
Time: shows the amount of time the module has been running since its last reset.
System Log: shows a running log of information about how the modules operating system is running. This log will also
log any errors and resets.
Routes: will display the current IP routes configured in the module.
IP statistics: show a number of statistics for each interface
TCP/UDP Statistics: shows the number of TCP and UDP connections currently established
Memory Statistics: shows the amount of memory available for each function.
Serial Statistics: shows the current status of each of the serial ports.
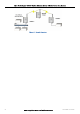
Network Traffic Analysis
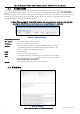
There are many devices and PC programs that will analyse performance of an Ethernet network. A freely available
a simple cost effective means for more advanced analysis. By monitoring traffic on
the wired Ethernet, a better idea of regular traffic can be discovered.
Network Analysis programs make configuration of a filter for the 450U-E a simple task.
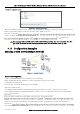
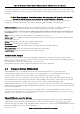
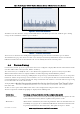
Channel Survey (Utilisation) 4.3
Channel Utilisation gives a visual display of how busy the current radio channel is over a given time period.
Channel Utilisation is logged by the radio over three separate time intervals: 1 Second which will cover the last 60
seconds; 1 Minute which covers the last 60 minutes; and 1 Hour which covers the last 60 hours.
At any given time, an Access Point and its associated clients occupy a radio channel. This radio channel, or frequency,
may contain interference from other radio transmitters. When installing or diagnosing the 450U-E modem, the potential
capacity of a given radio channel will be reduced by the existence of these other interfering RF signals.
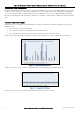
Channel Utilisation allows us to see how much RF activity is on a given channel as a percentage of the total utilisation. A
channel that is very busy will have high channel utilisation (usually 50% or greater). Conversely a channel that is quiet will
have low channel utilisation.
Channel Survey and Custom Survey can therefore be valuable tools to use when performing site surveys in order to
determine the best RF channel to use. It is also a valuable diagnostics tool for identifying the spare capacity on a given
channel, as well as possible sources of interference.
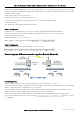
Channel Utilisation on a Live System:
Channel Utilisation can be used on a live system to get an indication of how much spare capacity the channel has for
additional data transfer. To identify possible interference on the current channel, observe the on the
Custom Survey page. If possible, temporarily disable all data transfer on the system, and if the Channel Utilisation remains
high this will confirm the presence of outside interference.