
User's Manual


Elpro Technologies 450U-E Wireless Ethernet Modem & Device Server User Manual
62 www.cooperbussmann.com/wirelessresources Rev Version 1.4.0
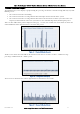
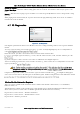
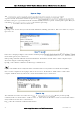
The third screen shot shows the Channel utilisation for each minute over a one hour period. Each minute is calculated
from the running average of the 60 second scan.
Figure 70 - Background Noise Minutes
The last screen shot shows the running radio background average noise level for each minute over the last 0ne hour
period.
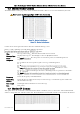
The Channel Survey page also shows two other screen shots (not shown here) which indicate the Percent Channel
Utilisation (average readings from each minute) and the Noise Floor in one hour intervals (The screens will only show the
last 60 hour period.
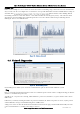
Custom Survey 4.5
Custom Survey is made up of two separate charts that can be configured to display different radio channel characteristics
over three different time scales (Seconds, Minutes or Hours).
The custom survey is essentially the same as the channel survey (explained in the previous section) except it allows
different channel related data to be displayed which is useful for diagnosing channel utilisation s problems.
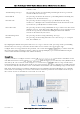
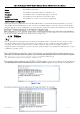
The default selection on the custom page will display the total percentage of transmitted frames over a 60 second period
in chart one and the total percentage of received frames over a 60 second period in chart two. From this default view we
can determine if there are too many transmissions being sent from this radio or if there is too many radio messages being
received from other sites in the radio network.
To display different data select the appropriate parameter from the drop down list and select the
to refresh the chart.
As there are two separate charts different data values can be displayed and compared at the same time.
The data components available for graphing are displayed in the following table:
Custom selections
Description
All TX & RX Frames
All ELPRO transmissions sent and received by the radio being monitored. This
option is the same as the normal channel survey which is explained in the previous
section.
All TX Frames
All data frames transmitted by the radio being monitored. This is the default for
chart one and will help to segregate the overall channel utilisation into transmissions
from the radio in question or transmissions from other radios. This option
encompasses TX first attempt, TX retries and TX Ack messages from below.
All RX Frames
All data frames received by the radio being monitored. This is the default for chart
two and will display only received ELPRO data frames.
TX First Attempt Messages
The amount of time spent transmitting first attempt messages from the modem, i.e.
All messages will be retried if the first do not succeed. This option allows us to log
the number of times messages fail to get through on the first attempt, which can
indicated some level of interference as the message may have clashed with other
radio messages. This option and the following two are useful for breaking down the
amount of time that is spent transmitting messages into normal transmissions,
retries and acknowledgements.
TX Retries
The percentage of time spent transmitting retry messages from the modem. This is