
User's Manual


Elpro Technologies 450U-E Wireless Ethernet Modem & Device Server User Manual
Rev Version 1.4.0 www.cooperbussmann.com/wirelessresources 61
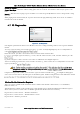
Channel Utilisation Graphs:
The Channel Survey screen displays a graph showing the percentage of time that a channel is being utilised by any of the
following causes:
1. The connected modem is transmitting.
2. The connected modem is receiving valid data from other Elpro 450U-E modems in the system.
3. The connected modem is receiving valid data from other 450U-E modems not in the system but on the same
frequency or from modems in the same system that are not communicating directly but through repeaters.
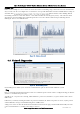
There are three different time periods displayed on the page, 1 second, and 1 minute and 1 hour. Each one shows the
channel utilisation and background noise level over that time period.
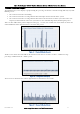
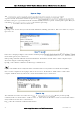
Figure 67 - Channel Utilization Seconds
The first screen shows the radio traffic on the channel over the last 60 seconds as well as a calculated average
percentage of utilisation for the 1 minute period.
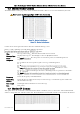
Figure 68 Background Noise (Sec)
The next screen shot shows the radio background noise level for the last 60 seconds.
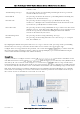
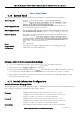
Figure 69 - Channel Utilisation Minutes